
Figure 2.
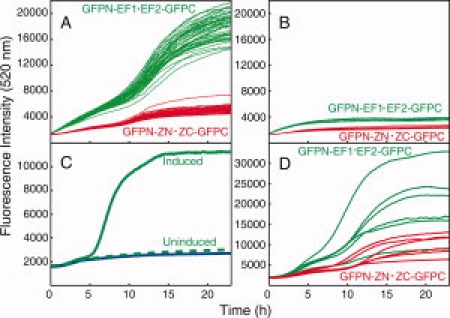
Fluorescence intensity as a function of time for co-expression of GFPN-EF1 and EF2-GFPC (green) or GFPN-ZN and ZC-GFPC (red) in black 96-well microplates. A and B: Fluorescence curves in vivo stemming from one colony for each case plated in 48 different wells. A) Data for 39 wells with GFPN-EF1 and EF2-GFPC and 37 wells with GFPN-ZN and ZC-GFPC. B) Data for nine wells with GFPN-EF1 and EF2-GFPC and 11 wells with GFPN-ZN and ZC-GFPC, that failed to develop fluorescence after 5 h. C) Comparison between the fluorescence from bacteria growing on inducing medium that do develop green fluorescence (green) and do not develop fluorescence (green, dashed) and with bacteria growing on non-inducing medium (blue). D) Fluorescence from six colonies with GFPN-EF1 and EF2-GFPC and six colonies with GFPN-ZN and ZC-GFPC shown as averages over wells, developing fluorescence, inoculated from the same colony.