
Figure 3.
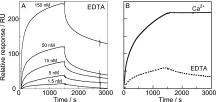
SPR-data for the interaction between the GFPN-EF1 and EF2-GFPC in the presence and absence of calcium. A) Association and dissociation curves in 3.4 mM EDTA for EF2-GFPC at five different concentrations, indicated in the figure, flown over immobilized GFPN-EF1. B) Comparison of SPR data for 15 nM EF2-GFPC flown over immobilized GFPN-EF1 in the presence of 2 mM CaCl2 (solid) or 3.4 mM EDTA (dashed).