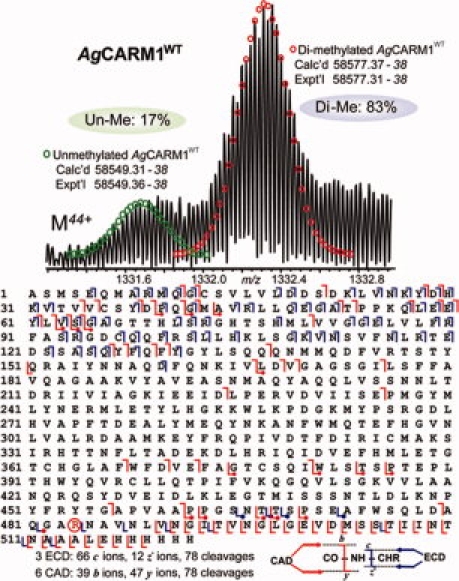
Figure 2.

High resolution ESI/FTMS analysis of AgCARM1WT expressed in E. coli. Top, ESI/FTMS spectrum of AgCARM1WT intact protein ions (M44+), suggesting AgCARM1WT is predominantly dimethylated. Bottom, fragmentation map from 3 ECD and 6 CAD spectra of both un- and di-methylated AgCARM1WT matched with assignments to the DNA-predicted sequence of AgCARM1WT with the removal of N-terminal methionine, localizing the dimethylation site to R485 (highlighted in circle). The fragmentation ions containing the dimethylated form were indicated in dots.
