
Figure 4.
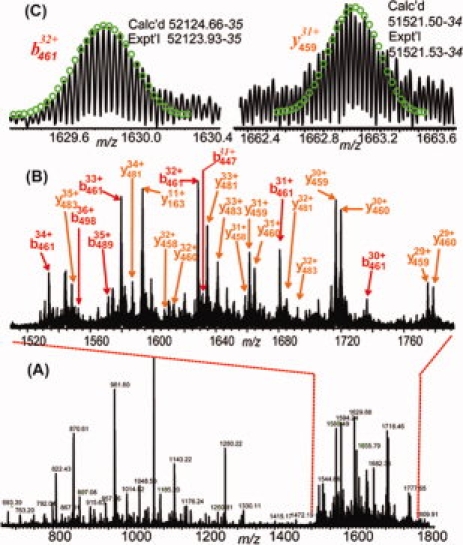
CAD spectrum of AgCARM1R485K intact protein ions. (A) CAD spectrum of isolated single charge state of AgCARM1R485K (M40+). (B) Expanded spectrum of (A) showing large fragmentation ions observed at m/z 1500–1800. (C) Representative isotopically resolved large fragmentation ions.