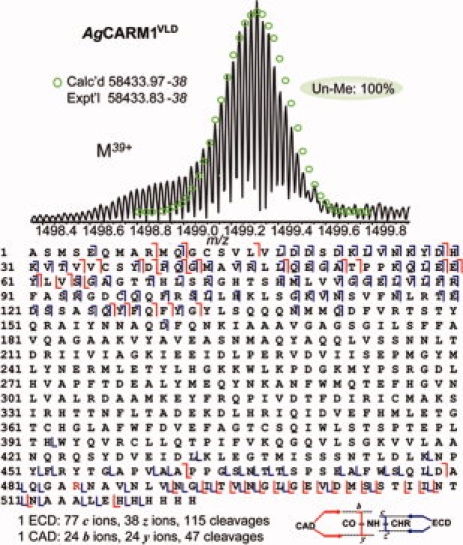
Figure 6.

Top–down MS analysis of AgCARM1VLD mutant. Top, ESI/FTMS spectrum of AgCARM1VLD (M39+), intact protein ions, suggesting AgCARM1VLD is not methylated. Bottom, Fragmentation map from both 1 CAD and 1 ECD spectra with assignments to the DNA-predicted sequence of AgCARM1VLD with the removal of N-terminal Met. [Color figure can be viewed in the online issue, which is available at www.interscience.wiley.com.]
