
Figure 2.
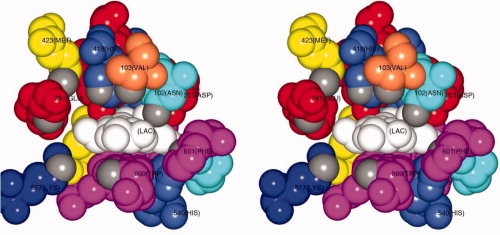
Stereo representation of the active site pocket of β-galactosidase with a bound lactose molecule (white). The coordinates used for the figure are from Protein Data Bank file 1JYN for the complex between the inactive E537Q variant and lactose. All residues that contribute atoms to the pocket are shown color coded by residue property (magenta = aromatic, coral = nonpolar, yellow = methionine, blue = basic, cyan = polar, red = acidic). Grey atoms are those used to define the opening to the pocket (see text). Residues 418, 103, 102, and 201, which all pack together to form part of the “top” surface of the pocket, are disrupted by the substitution of His-418 with glutamate (see text). The active site ions are not visible in the figure but lie behind the sidechains of His-418 (Mg2+) and Asp-201 (Na+) (Figure prepared with CCP4 mg.16)