
Figure 5.
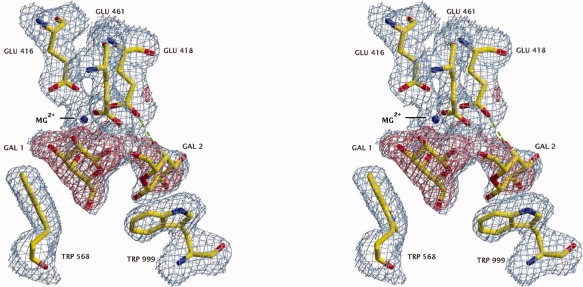
Stereoview showing the electron density (2fo-fc, contoured at 1s—shown as blue netting) and the positions of the two galactoses that bind to the active site of the H418E variant. The red netting is positive (3s) fo-fc “omit” electron density. Here, fo refers to amplitudes measured from the galactose-soaked crystals, while fc (and the phases) are calculated from a model of the H418E variant with no waters or sugars in the active site and refined against the fos. A putative hydrogen bond between Glu-418 and the O4 of the galactose binding in the acceptor position is shown as a dashed green line. Gal 1 refers to the galactose bound as it does to the native while Gal 2 is the galactose that binds to this variant but not to native. The stick model based on the refined coordinates is also shown. Oxygens are in red, carbons are in yellow and nitrogens are in blue. The active site Mg2+ is shown as a blue ball. [Figure was prepared with ImageMagick (www.imagemagick.org).] [Color figure can be viewed in the online issue, which is available at www.interscience.wiley.com.]