
Figure 6.
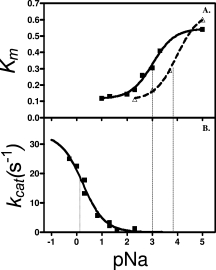
A. The changes of the Km values (mM) of H418N- and native β-galactosidase as functions of pNa. The triangles (dashed line) represent native β-galactosidase and the squares (solid line) represent H418N-β-galactosidase. B. The kcat values (s−1) of H418E-β-galactosidase as a function of pNa. The thin perpendicular lines on the plots show the pNamid values.