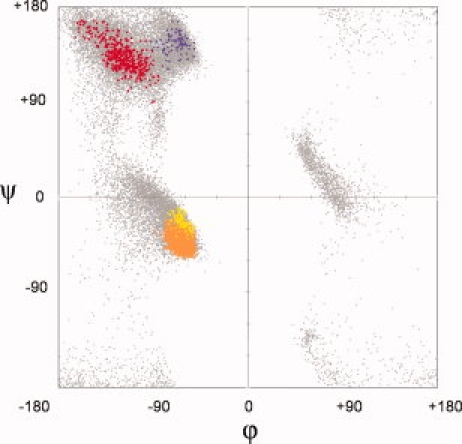
Figure 3.

Locations and breadths of common linear groups in proteins. The composite scatter plot shows all triplets of residues found in the fine (20° × 20°) searches. Separate colors indicate the α (orange), 310 (yellow), β (red), and PII (purple) residues. For reference, a background plot (gray) shows all the residues in the 1.2 Å data set. The α and 310 regions overlap. The most densely populated centers of each region are at α = (−63, −43), 310 = (−62, −22), β = (−116,129), PII = (−65, 145). Supporting Information Figure S4 is similar, but based on 90,211 residues from diverse crystal structures at 1.75 Å resolution or better.
