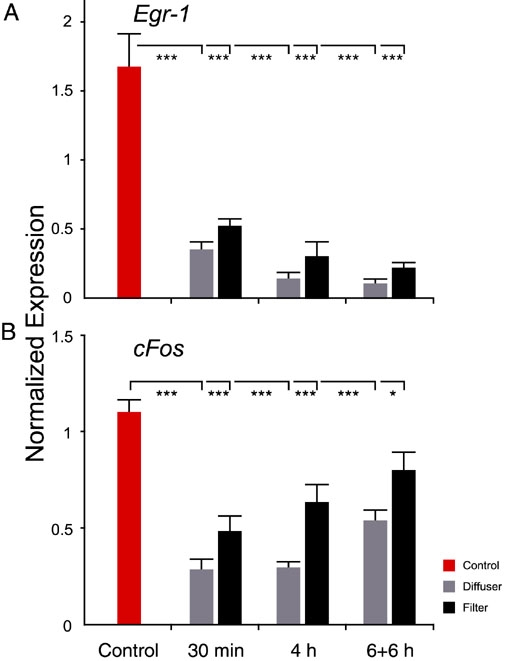
Figure 3.

Expression of Egr-1 and cFos in control animals and as a function of time in treated animals. The mRNA expression of Egr-1 (A) and cFos (B) in diffuser- and neutral density (ND) filter-treated eyes is displayed as a function of time. Normalized expression values were plotted on the ordinate. Error bars denote standard errors of the mean (SEM). Statistical results represent the ANOVA followed by Dunnett's test (comparisons with a control). Single asterisk indicates p<0.05 *; while triple asterisk denotes p<0.001 ***. Three control animals and six treated animals were used for each experiment.
