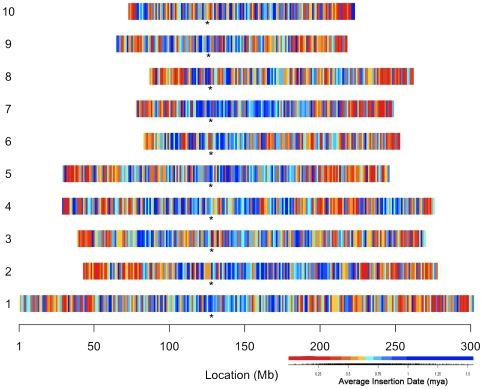
Figure 6. The chromosomal distribution of full-length LTR retrotransposon insertion histories.
The insertion date of each full-length LTR retrotransposon was determined and these values were averaged for all full-length LTR retrotransposons occurring in each 1 Mb bin. The heat map was derived by classifying the average insertion age into equal-interval quantiles. The distribution of these classified ages are illustrated as color tiles superimposed under the empirical cumulative distribution of the average insertion dates for each bin. Asterisks indicate approximate centromere positions.

