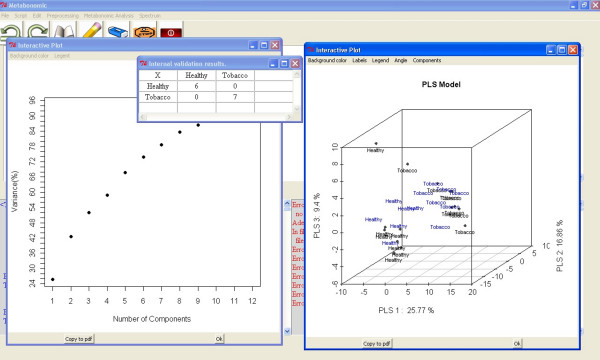
Figure 4.
Metabonomic GUI used for PLS-DA. Interactive graph (right) with the first three PLS components score plot of two classes of samples (healthy and tobacco). The black samples are the samples used to build the model and the blue samples are the validation samples. In addition, the validation result and the explained variance are shown.

