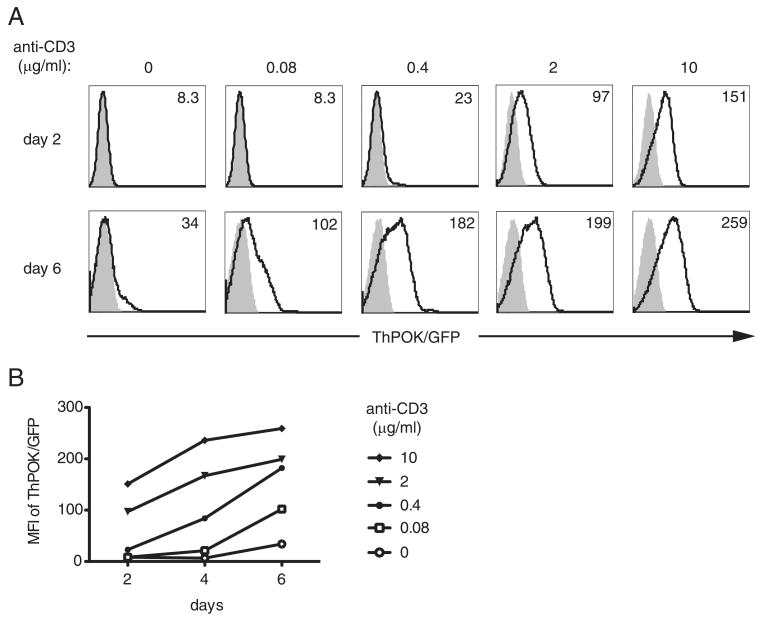
FIGURE 1.
Activation of peripheral CD8 T cells leads to ThPOK up-regulation. A, Splenic CD8 T cells derived from ThPOKwt/gfp (open histograms) or ThPOKwt/wt (shaded histograms) mice were exposed to the indicated concentrations of anti-CD3 and a fixed concentration of soluble anti-CD28 (1 μg/ml). After 2 days the cultures were removed from anti-CD3-coated plates and cultured in the presence of rIL-2 (10 U/ml). At 2, 4, and 6 days of culture the level of ThPOK/GFP expression was assessed by flow cytometry. The numbers inserted in the histograms refer to the GFP MFI. B, MFI of GFP expression vs time in culture is plotted. Results are representative of three independent experiments.

