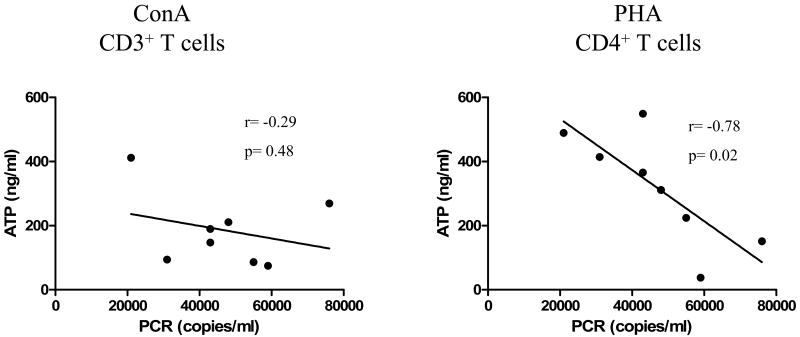
Figure 2. Correlation of ATP release in response to ConA or PHA stimulation and EBV load in HVL patients.
ATP (ng/ml) released by peripheral blood CD3+ or CD4+ T cells in response to ConA or PHA stimulation, respectively, from HVL patients were compared to peripheral blood EBV load levels (genomic copies/ml) measured by PCR on the day of analysis. Each dot represents the measurement of each individual patient.

