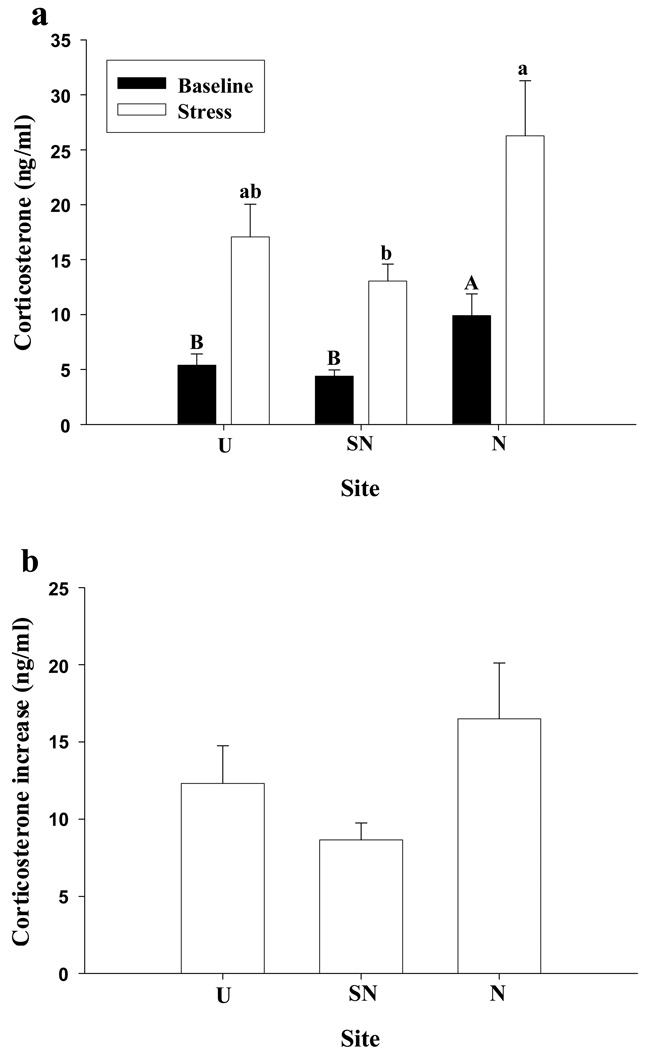
Figure 1.
(a) Circulating concentrations of corticosterone in tree lizards (Urosaurus ornatus) before and after handling stress at the urban (U), semi-natural (SN), and natural (N) sites. Upper case letters denote significant differences of baseline levels and lower case letters denote significant differences of stress-induced levels of corticosterone among the different sites (α = 0.05 level). Additionally, stress-induced CORT concentrations were significantly greater relative to baseline CORT concentrations for all sites (α = 0.05 level). (b) The magnitude of the change in corticosterone, at three sites sampled across the urban-rural gradient of Phoenix, Arizona. (Note: a similar result was found using percentage increase above baseline). Error bars represent 1 standard error.

