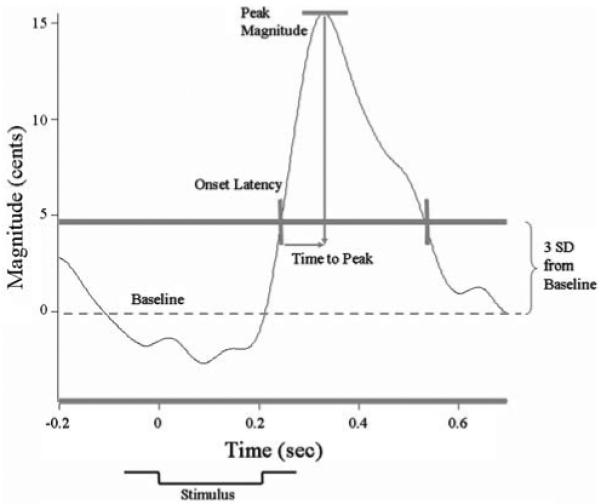
Fig. 1.

Exemplar vocal response to pitch perturbation during auditory feedback. The stimulus (indicated underneath the x-axis) begins at time 0 and lasts 200 ms. To evaluate the pitch-shift reflex, first the baseline mean frequency (cents) and three standard deviations (SD) from the mean as threshold were measured. From these benchmarks, the pitch-shift reflex can be evaluated. The time when the frequency exceeds threshold is the “onset latency” of the response; the maximum peak of the response is the peak “magnitude”; the difference between the latency at which the peak magnitude is achieved and the onset latency is the “time to peak”; and the time when the frequency falls below the three SD threshold again represents the end of the response reflex. The important response features are demarcated in gray color. Note that the y-axis has been de-meaned to 0 cents
