
Fig. 2.
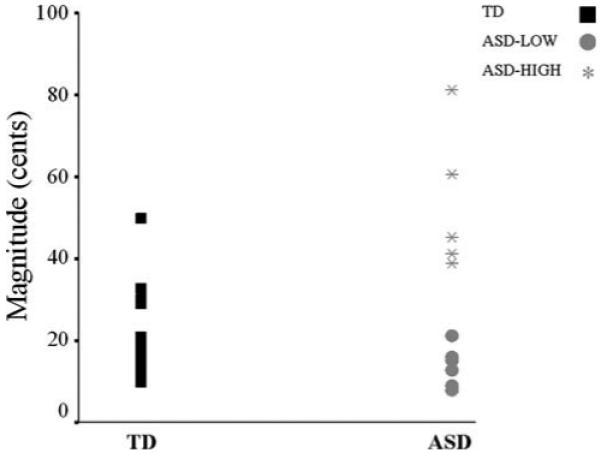
Dot plot of compensatory response magnitudes (cents) of TD children (left; black squares) and children with ASD (right; ASD-LOW: gray circles and ASD-HIGH: asterisks). Children whose magnitudes were within ±1.65 SD of the typical range comprise the ASD-LOW group, whereas children whose magnitudes exceeded +1.65 SD comprise the ASD-HIGH group