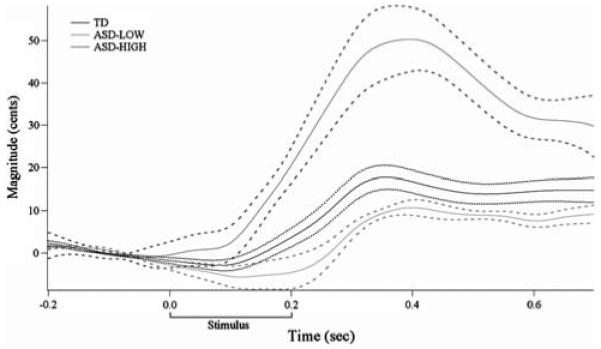
Fig. 3.

Grand average TD (black), ASD-LOW (light gray) and ASD-HIGH (dark gray) response magnitude curves and standard error (TD: dotted lines; ASD: dashed lines). Whereas the TD response to pitch perturbation is approximately 20 cents, the ASD-LOW group response is significantly smaller, and the ASD-HIGH group response is significantly larger than the TD group
