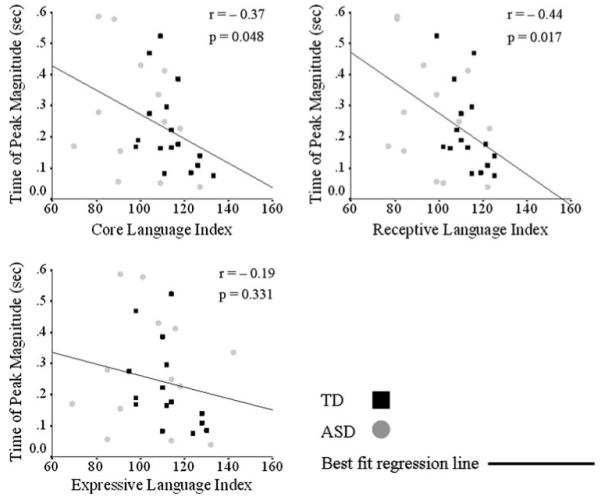
Fig. 5.

Relationship between time of peak magnitude and language ability. Statistically significant Pearson’s correlations (r ≥ 0.32 and p ≤ 0.05) existed between the time of peak magnitude (s) core (top left) and receptive (top right) language abilities, such that a shorter time to peak was related to better core and receptive language abilities. There was no relationship between time of peak magnitude and expressive language ability (bottom left). Time of peak magnitude and behavioral scores of individual subjects (TD, black squares; ASD, gray circles) are plotted, as well as the best fit regression line for the entire sample. Correlation r and p values are reported next to each plot
