Figure 1.

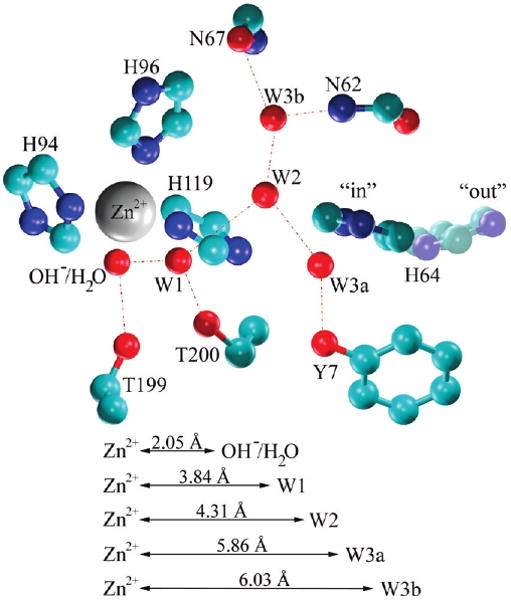
Schematic representation of the WT HCA II active site showing the active site water cluster. Coordinates were taken from the X-ray crystallographic structure PDB accession # 2CBA.14 Red dotted lines indicate hydrogen bonding.

Schematic representation of the WT HCA II active site showing the active site water cluster. Coordinates were taken from the X-ray crystallographic structure PDB accession # 2CBA.14 Red dotted lines indicate hydrogen bonding.