
Figure 4.
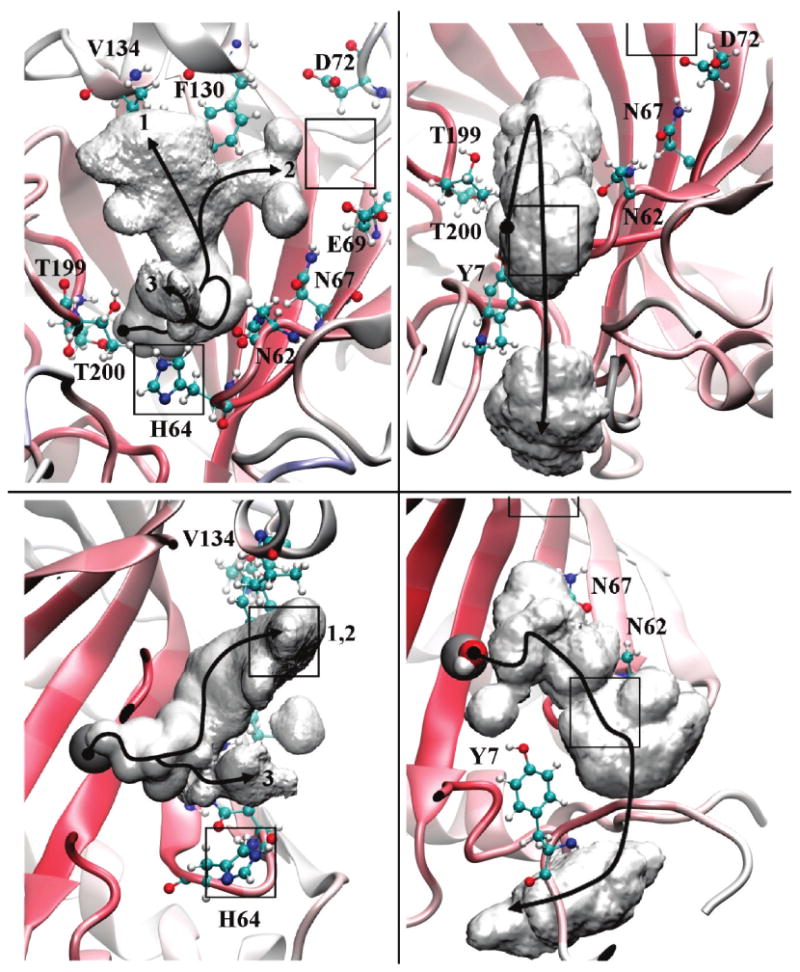
Spatial occupancy plot of the CEC for the excess proton in the HCA II enzyme active site. The left panels (top and bottom) are determined from simulations of the HCA II enzyme when His64 is not included as an explicit acceptor group of the excess proton. The right panels (top and bottom) are determined from simulations of the HCA II enzyme with His64 included as an explicit acceptor group for the excess proton. The gray volume represents the isosurface wherein the excess proton CEC resides 98% of the time. The numbers indicate the respective paths for the CEC (i.e., 1, 2, or 3). (Top) Representation looking down the active site cavity with H64 near the bottom, T200 and T199 on the left, N62, N67, and E69 on the right, and D72, F130, and V134 on top. (Bottom) Representation looking from the side with H64 on bottom and the zinc at the base of the isosurface on the left. The black boxes represent binding sites for the chemical rescue agent 4MI from 1MOO.pdb. The black line depicts the most probable path the CEC may take inside the CEC density. The black circle at the beginning of each path resides on the catalytic zinc.