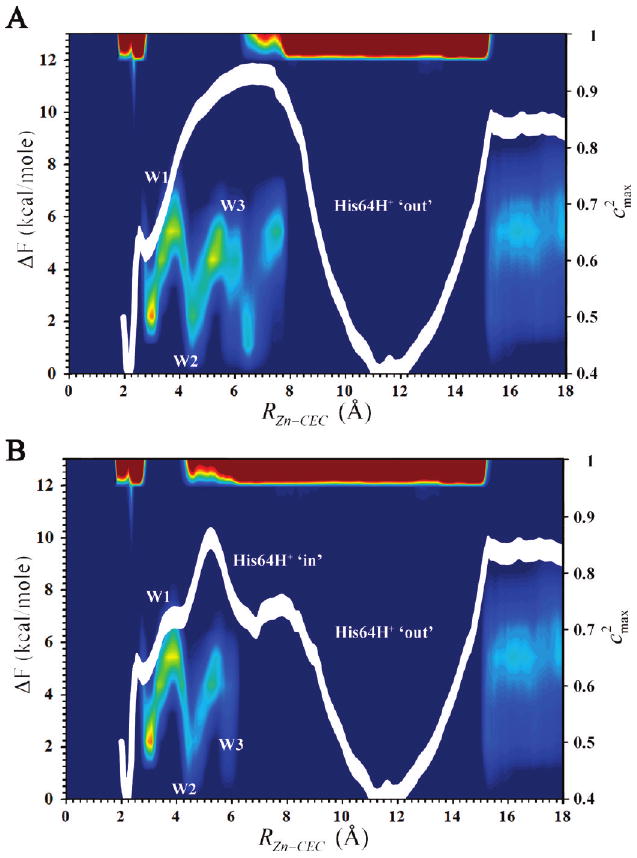
Figure 5.

Free energy curve for the zinc-bound water deprotonation reaction as a function of the radial distance of the CEC to the catalytic zinc, RZn–CEC. The thickness of the line denotes the standard deviation, which was evaluated to be 0.4 kcal/mol. Also shown is the largest EVB state population (colored contours) as a function of the center of excess charge coordinate RZn-CEC. Red indicates high probability while blue indicates low probability. (A) His64 in the “out” orientation. (B) His64 in the “in” orientation.
