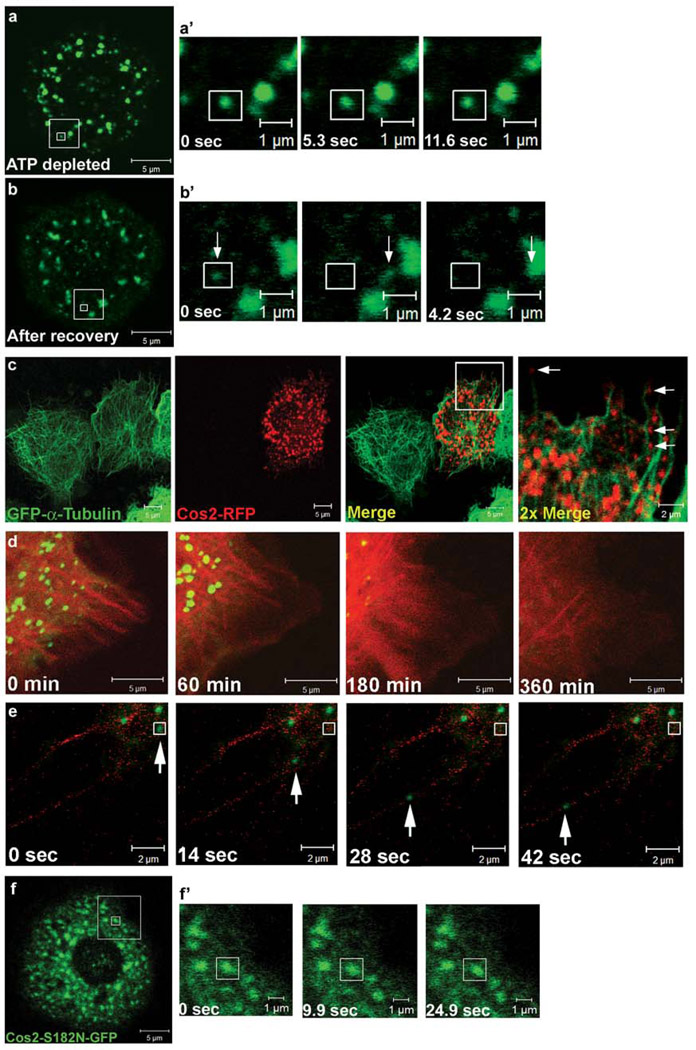
Figure 3. Cos2 motility requires microtubules and ATPase activity.
The large box in panels (a) and (b) indicates the enlarged area depicted in the corresponding time series (a’ and b’). The smaller boxes indicate the origin of a single puncta that is tracked, over time. (a– a’) S2 cells expressing cos2-GFP were ATP depleted by treatment with 5 mM sodium azide and 1 mM 2-deoxyglucose. Time-lapse images were taken 30 minutes after ATP depletion. The vast majority of Cos2-GFP puncta were immobile, relative to the vehicle treated S2 cells, which exhibited similar motility to untreated wt Cos2-GFP (Figure S3). (b– b’) Cos2 movement is recovered after ATP levels are restored, verifying the reversibility of the ATP depletion. The same cell as in (a) was reimaged after the ATP depletion solution was removed and the cell was allowed to recover for 30 minutes in fresh media. The movement of a single puncta (indicated by arrows) is tracked over a short time course. (c) Cos2 appears to localize along MT tracks. cos2-RFP was expressed in a S2 cell line stably expressing GFP-α-tubulin and imaged in live cells. The large box in the merge panel indicates the enlarged area depicted in the 2x merge panel. Individual Cos2-RFP puncta aligning with MTs are marked by arrows in the rightmost panel. (d) Live images of S2 cells co-transfected with plasmids expressing cos2-GFP and mCherry-tubulin, then treated with nocodazole. Images show a single cell over the course of 6 hours and show the correlation between dissociation of Cos2-GFP puncta and MT destabilization induced by nocodazole treatment. A more extensive time course of this nocodazole treated cell, showing Cos2-GFP and mCherry-tubulin in separate channels, is shown in Fig. S5a. (e) Live images of S2 cells expressing cos2-GFP and mCherry-tubulin, treated with 5 µM cytochalasin for 18 hours. Cytochalasin disrupts the actin cytoskeleton, allowing the formation of long MT-enriched projections, along which Cos2-GFP puncta appear to co-localize and move. The puncta indicated by the arrow traveled approximately 8 µm along the visible MT projection. (f–f’) Live images of S2 cells expressing cos2-S182N-GFP. (f) Cos2-S182N-GFP shows a highly punctate staining pattern in a subset of cells, similar to wt Cos2-GFP. The large box in panel (f) indicates the enlarged area depicted in the corresponding time series (f’) and the smaller box indicates the origin of a single puncta that is tracked, over time. (f’) Cos2-S182N-GFP puncta tracked over time do not exhibit significant motility (see also Fig. S3b).

