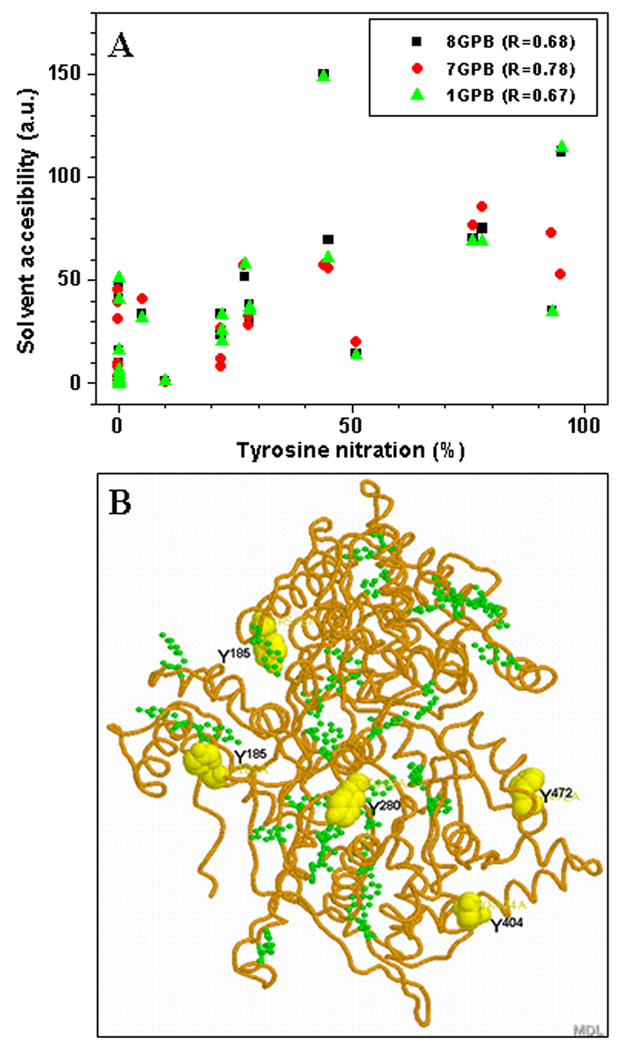
Figure 5.
A – Correlation analysis of Tyr nitration vs. solvent accessibility surface area (SASA) for different PDB structures of rabbit muscle phosphorylase b. The respective correlation coefficients are shown in the insert. B – Localization of the peroxynitrite-reactive Tyr residues: yellow colored “spacefill” residues (Tyr185, Tyr280, Tyr404, Tyr472, and Tyr548) exhibit >50% nitration level after reaction of 1 mM peroxynitrite with 15 µM Ph-b, while green “ball-and-stick” Tyr residues show lesser nitration levels or lack of nitration by peroxynitrite.

