
Figure 4.
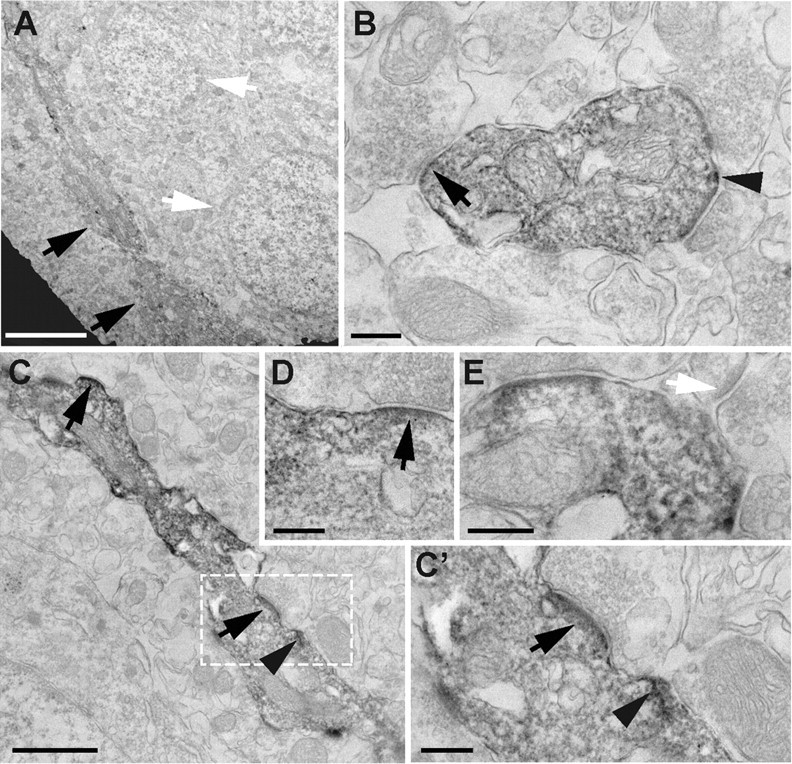
Immunoelectron microscopy analysis of ErbB4 expression in rat CA1 interneurons. Shown are representative images of ErbB4-IR in the transition area between strata pyramidale and radiatum. A, Low-magnification image of an ErbB4-positive interneuron cell body and primary dendrite (black arrows) located adjacent to two large immunonegative pyramidal cell bodies with prominent nuclei (white arrows). B, Cross-sectional view of an ErbB4-immunoreactive interneuron dendrite surrounded by multiple aspiny glutamatergic synapses. Both surface and internal membranes are labeled. Surface ErbB4-IR is strongest at (arrow) or adjacent to (arrowhead) postsynaptic sites. Similar results were obtained in longitudinally cut interneuron dendrites as exemplified in C and the magnified areas (C′, D). E, Example of a dendritic spine (white arrow) located next to an ErbB4-immunoreactive dendrite. Scale bars: A, 4 μm; C, 1 μm; B, C′, D, E, 250 nm.