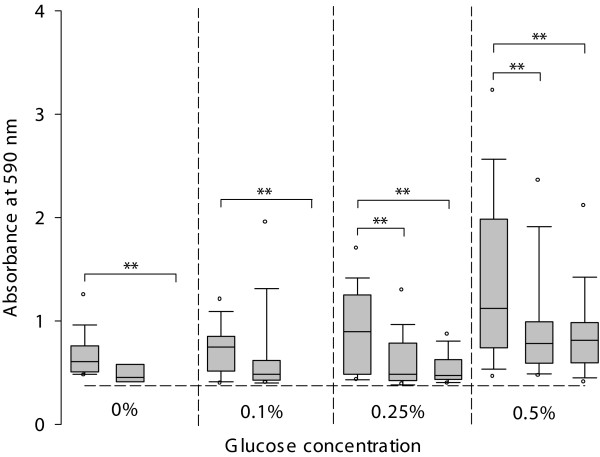
Figure 3.
Biomass quantification of MSSA and MRSA. Absorbance (A590) of the crystal violet stained biofilm matrix for strong biofilm formers (with A590 above the threshold value of 0.374, represented by the horizontal dashed line) at different glucose concentrations. Boxplots at the left show MRSA, in the middle MSSA with MRSA associated MLST CCs and at the right MSSA with MSSA associated MLST CCs. The lower and higher boundary of the box indicates the 25th and 75th percentile, respectively. The line within the box marks the median. Whiskers above and below the box indicate the 90th and 10th percentiles. Open circles indicate the 95th and 5th percentiles. Asterisks denote statistically significant difference, (*) P < 0.05 and (**) P < 0.01.

