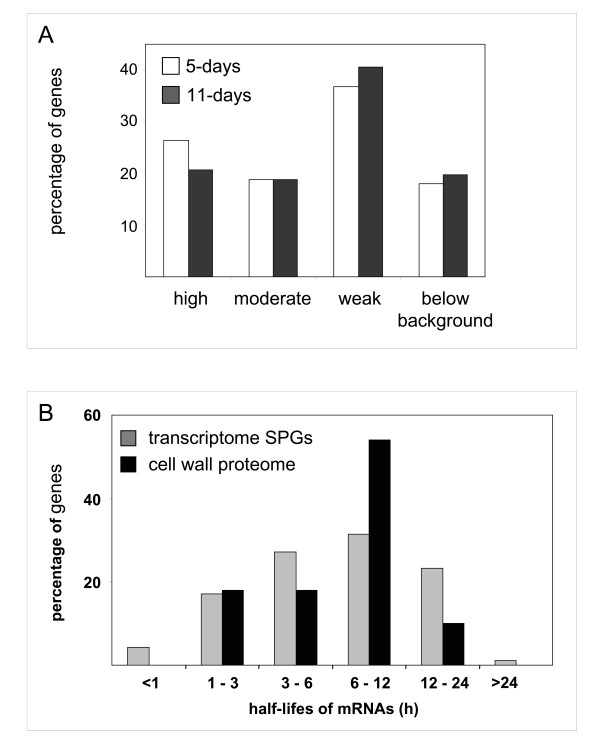
Figure 3.
Level of transcripts of genes encoding CWPs identified through proteomics. A. The levels of transcripts of genes were determined by the CATMA analysis in 5- and 11-day-old hypocotyls (white and dark grey bars respectively). Percentage of genes falling in the following three categories are represented: high transcript level corresponds to log2 values of the mean signal intensity higher than 10, moderate to values between 9 and 10, and weak to values between background (6.83) and 9. B. Half-lifes of mRNAs (in hours) corresponding to SPGs having high or moderate levels of transcripts (grey bars) or to proteins identified through cell wall proteomics (black bars). Percentage of genes in each range of half-lifes is indicated for each set of genes. Half-lifes of mRNAs in cell suspension cultures were from [37].

