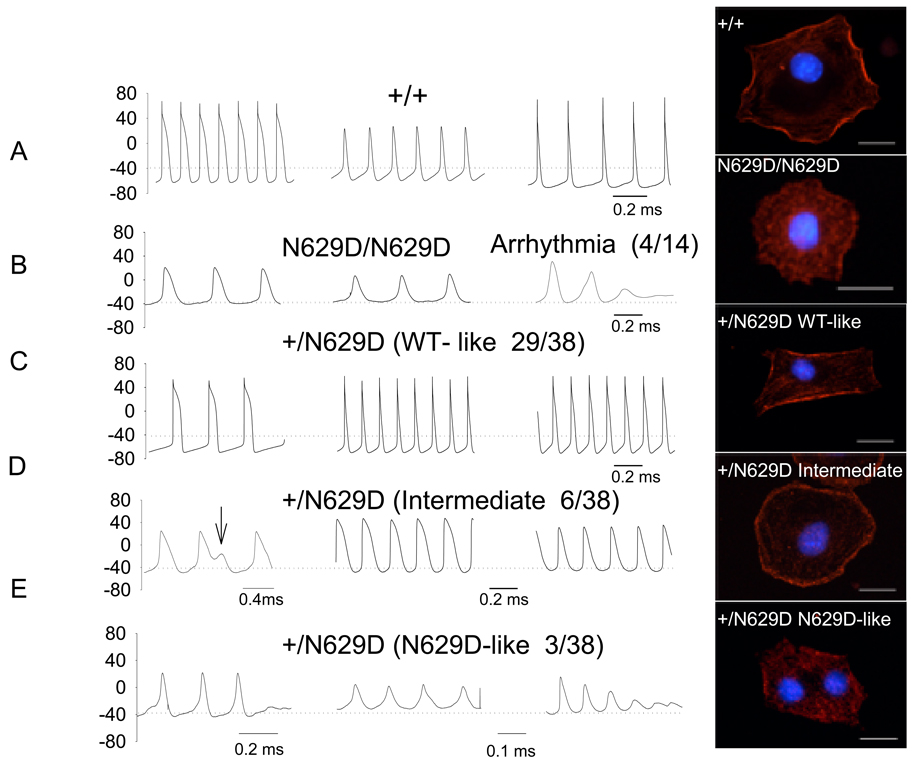
Figure 3. Representative action potentials recorded in +/+; homozygous and heterozygous N629D.
For each and every cell, the IKr phenotype is evaluated in voltage-clamp mode was followed by recording the paired action potentials in current-clamp mode. Action potentials from +/+ myocytes manifest a spectrum of action potential durations and resting potential (Panel A) some with features of sinus node- like cells, some with features like atrial-like action potentials. In Panel B action potentials from N629D/N629D mice show homogeneous features: extreme depolarization, prolonged APD and failure to repolarize with oscillatory triggered arrhythmias. Action potentials recorded in heterozygous +/ N629D are related to the paired IKr phenotype : the action potentials associated with a WT-like IKr in Panel C and intermediate IKr phenotype in Panel D and N629D/N629D-like in Panel E. Heterozygous +/N629D WT- like myocytes have action potential features indistinguishable from +/+. Action potentials from +/N629D embryo hearts with an intermediate IKr phenotype show depolarization and prolonged APD, Arrowhead indicates EAD. Action potentials from +/N629D embryo hearts with N629D phenotype show similar pattern of N629D/N629D embryo hearts. The numbers with in the brackets show the number of cells which showed the various phenotypes in the +/N629D embryos.
Representative examples of the cellular distribution of the mERG proteins were evaluated in isolated cardiac myocytes and shown in the right hand column. The +/+ protein is dominantly expressed in the plasma-lemma whereas the N629D/N629D protein is dominantly expressed intracellularly (see text). A spectrum of patterns of protein expression are observed in the +/N629D heterozygous myocytes. The majority of cells (108/133) manifest a distribution pattern similar to WT. A minority of cells (14/133) have a distribution virtually identical to N629D/N629D. Another group of cells have a phenotype intermediate between WT and N629D/N629D. In these cells, the protein is distributed in a peri- or sub-plasma-lemmal location but the protein is expressed as punctuate dots, rather than the linear sheaths of protein seen in WT. The bars indicate 20 µM.

