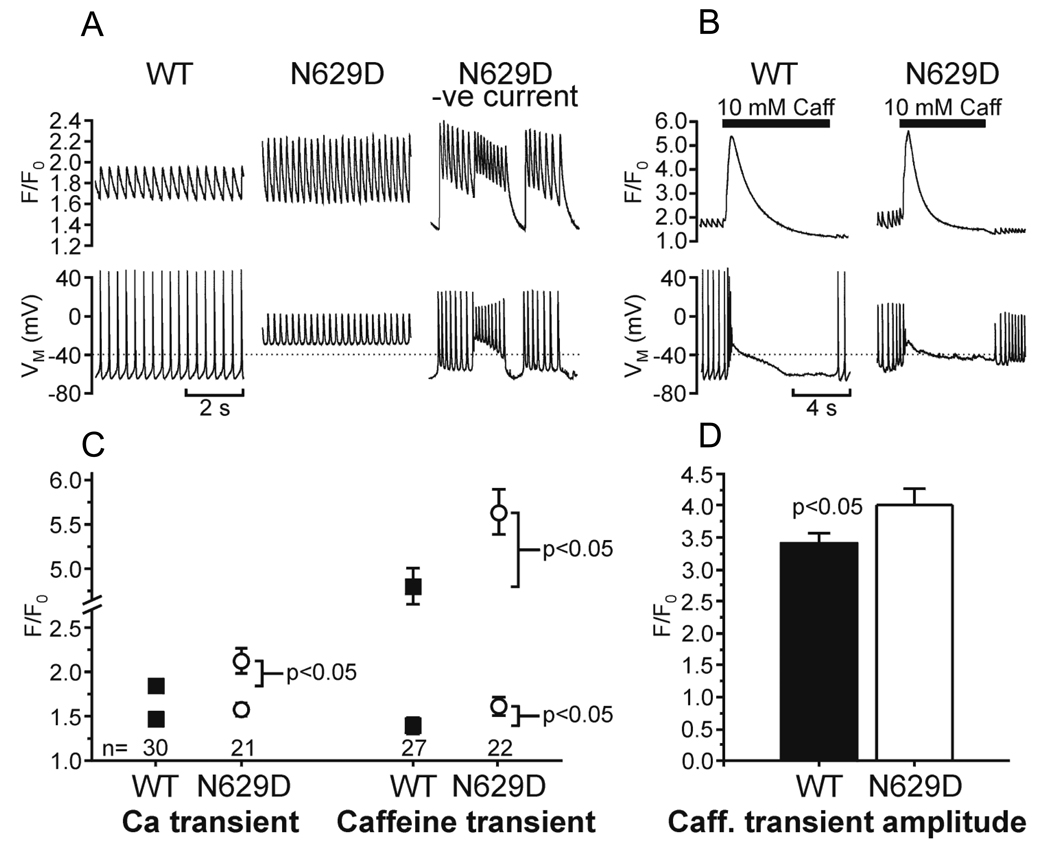
Figure 4. Intracellular calcium signals in voltage-clamped wild type (WT) and N629D/N629D E9.5 myocytes.
A, B: Representative tracings. Upper panels show calcium signal (F/F0), lower panels show membrane potential (VM). In A, the WT cell displays spontaneous action potentials with corresponding calcium transients. The N629D cell is depolarized (resting membrane potential = −30 mV) and shows rapid oscillatory potentials and elevated peak [Ca2+]. When its resting membrane potential is lowered to −65 mV by injecting negative current it exhibits abnormal action potentials with prominent early afterdepolarizations. B: Ca transients in response to rapid application of 10 mM caffeine. C, D: Summary data. Mean ± SEM is shown for Ca transients and caffeine-induced transients, with n (cells) indicated. Number of animals was 7 WT, 6 N629D. Statistically significant differences are shown. Error bars are omitted when smaller than symbols.

