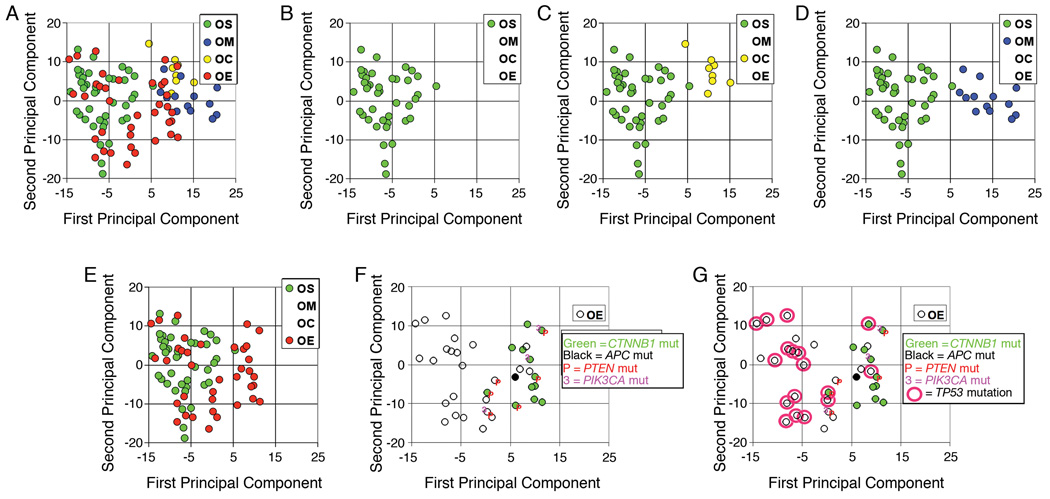
Figure 2.
Gene expression profiling of primary ovarian carcinomas. A) Principal component analysis (PCA) of 99 ovarian carcinomas using all probe sets on the U133A array; the first two principal components are shown. Individual tumors are annotated with histopathologic type as indicated (green-OS, serous; blue-OM, mucinous; yellow-OC, clear cell; and red-OE, endometrioid); B) Same PCA plot showing only serous carcinomas; C) Same PCA plot showing only serous and clear cell carcinomas; D) Same PCA plot showing only serous and mucinous carcinomas; E) Same PCA plot showing only serous and endometrioid carcinomas; F) Same PCA plot showing only endometrioid carcinomas annotated with mutational status of CTNNB1, APC, PTEN and PIK3CA as indicated; G) Same PCA plot showing only endometrioid carcinomas annotated with mutational status of CTNNB1, APC, PTEN, PIK3CA, and TP53 as indicated. ****Figure (modified version) reprinted from Cancer Cell, 11:321–333, 2007 (R Wu et al., Mouse Model of Human Ovarian Endometrioid Adenocarcinoma Based on Somatic Defects in the Wnt/β-Catenin and PI3K/Pten Signaling Pathways)10 with permission from Elsevier.

