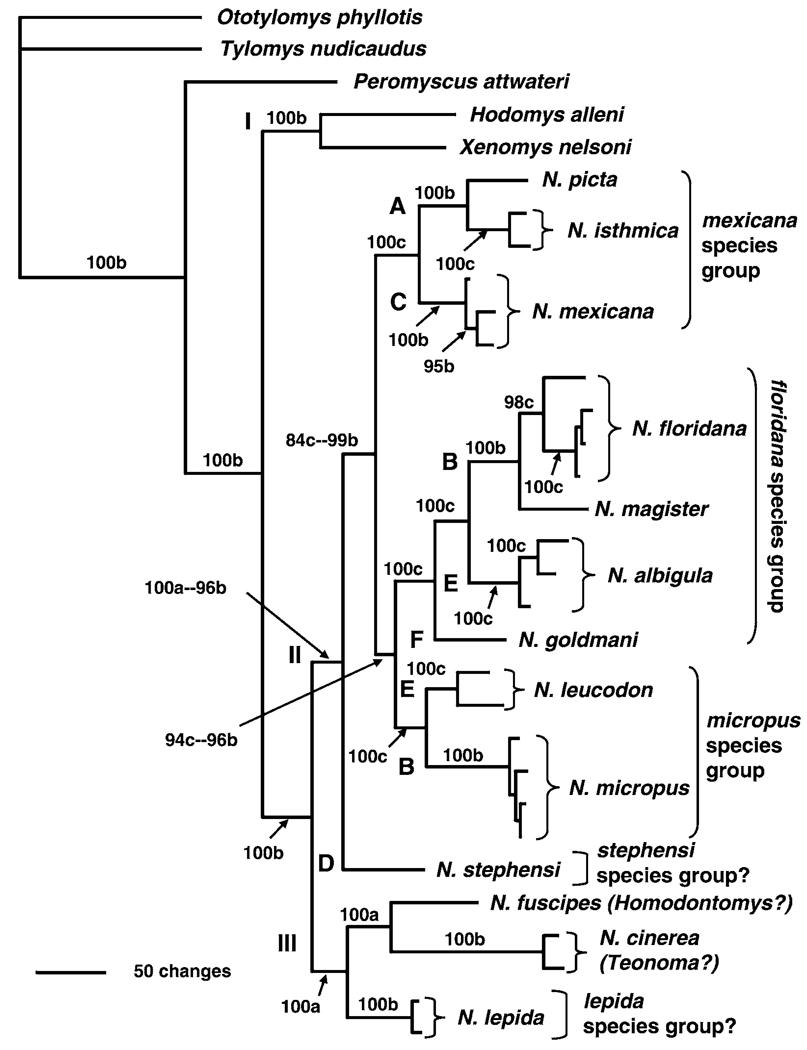
FIG. 3.
Phylogenetic tree based on combined analysis of the nuclear alcohol dehydrogenase gene 1 (Adh1-I2) and cytochrome-b gene (Cytb) using Bayesian analysis (GTR+I+G model of evolution). Posterior probabilities are shown above branches—values contributed by Adh1-I2 data are indicated by “a,” values contributed by Adh1-I2 and Cytb data (both data sets) are indicated by “b,” and values contributed by Cytb data are indicated by “c.” Roman numerals (I–III) depict major clades and letters (A–F) depict minor clades as defined in text.

