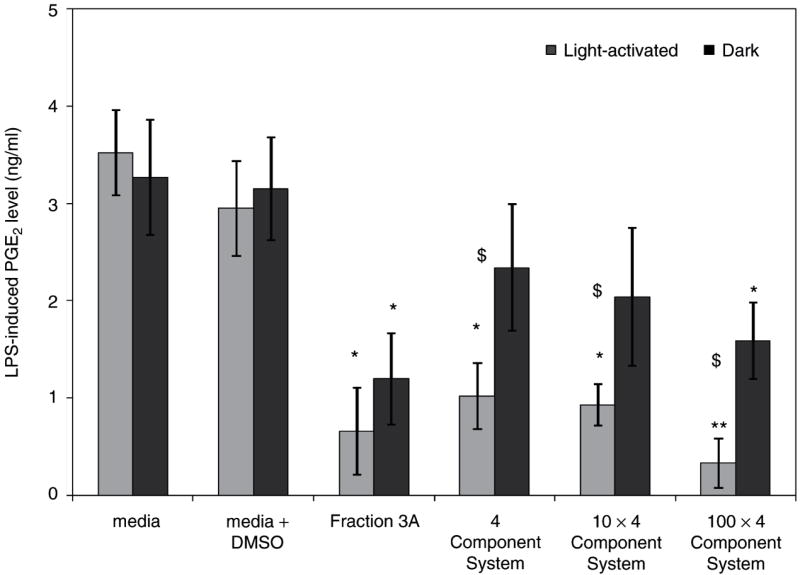
Figure 5.
Fraction 3A was compared with 1, 10, and 100× dilutions (four-component system) of the four identifiable constituents (amentoflavone, chlorogenic acid, pseudohypericin, and quercetin) in fraction 3A (from data published in Hammer et al., 2008). Data are presented as LPS-induced PGE2 production (ng/mL) as mean + standard error; *p < 0.05 as compared to media + dimethylsulfoxide (DMSO) control using the Tukey–Kramer test for multiple comparisons. n = 4 for each treatment. Each fraction/four-component system was assayed in both light-activated and dark treatments and differences between light and dark treatments in PGE2 levels are noted by $ (p < 0.05).

