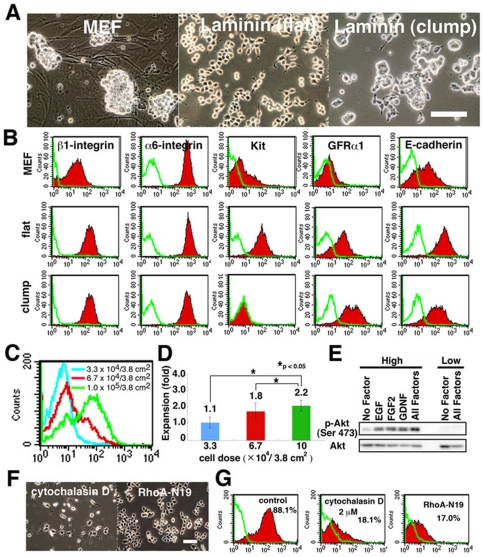
Figure 1. GS cells express Kit.
(A) Morphological appearance. (B) FACS analysis of surface markers. Green line indicates the control. (C, D) Effect of cell density on Kit expression (C) and GS cell expansion (D). Cells were plated at the indicated density on laminin (n = 6). Values indicate the degree of expansion from the initially plated cells. (E) Western blot analysis of GS cells plated at 5×10⁵ or 3×10⁴ cells/9.5 cm2. (F, G) Appearance (F) and Kit expression (G) of GS cells after cytochalasin D treatment or transfection of RhoA-N19 cDNA. Bar = 100 µm (A, F).

