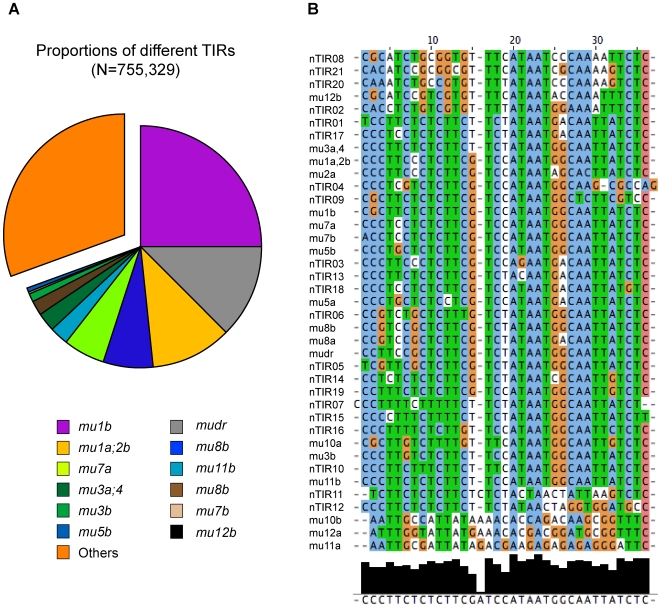
Figure 1. Frequencies of known and novel Mu pTIRs.
(A) Proportions of different 34 bp pTIRs detected in the 454 dataset. The codes “a” and “b” designate arbitrarily defined left and right TIRs of a given Mu element. (B) Clustalw-based clustering of novel pTIRs (nTIRs), each of which was supported by at least 100 reads and exhibited a minimum edit distance of 2 from all previously described pTIRs (Methods).

