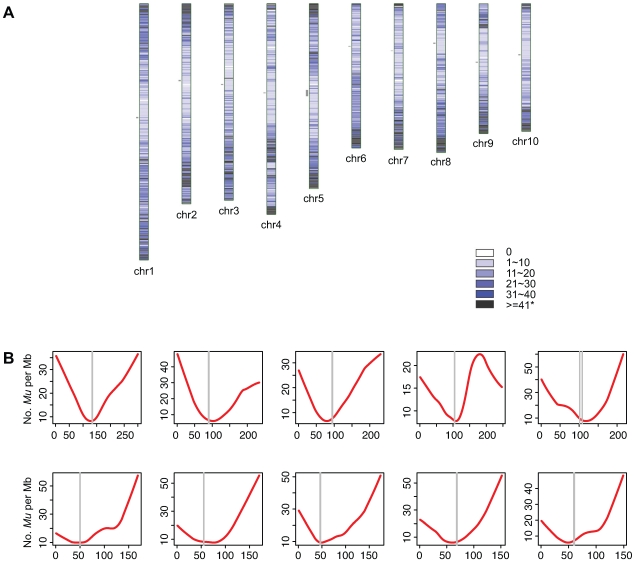
Figure 3. The distribution of Mu insertion sites in the maize genome.
(A) Each horizontal line on chromosomes represents a 1-Mb window. Lines are intensity- and color-coded to indicate the number of Mu insertions per Mb. Grey vertical lines represent the approximate positions of centromeres [67]. (B) The locally-weighted polynomial regression (LOWESS) curve with smooth span (f) equaling to 0.4 of the number of Mu insertions per 1-Mb window (y-axis) was plotted versus the corresponding window's coordinates (Mb, x-axis). The vertical paired grey lines represent approximate centromere positions [67]. Those patterns we observed are unlikely to be artifacts of the removal of repetitive MFS, because only a small proportion of all MFSs (1.4%) were removed based on their ability to map to multiple positions in the genome.

