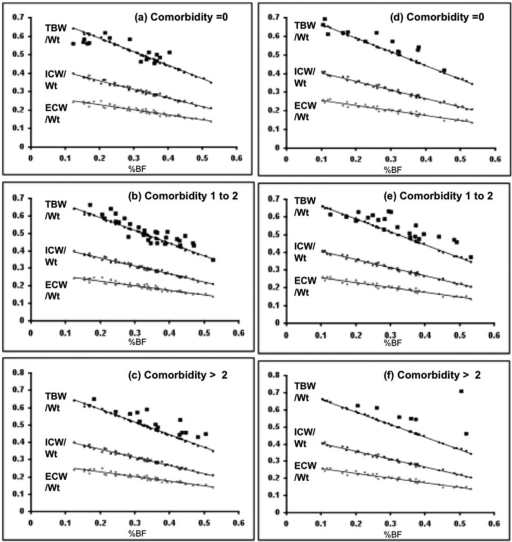
Figure 3.
Each panel shows the relationship between body water spaces normalized to body weight, TBW/wt (●), Intra-cellular water/wt (○), and ECW/wt (●) and percentage of body fat (x axis) as determined by BIA. The linear regression lines indicate the BIA algorithm-derived fluid volumes (all points very close to the line) for these fluid volumes; for TBW especially, this can be seen to assume the same hydration fraction (0.73 for lean tissue) for all patients. Superimposed is the measured TBWD/wt (■). As comorbidity increases (baseline [A through C]) and longitudinally (12 mo [D through F]), it can be seen that although the TBWD/wt runs parallel to the BIA predictions, the patients are relatively more overhydrated.

