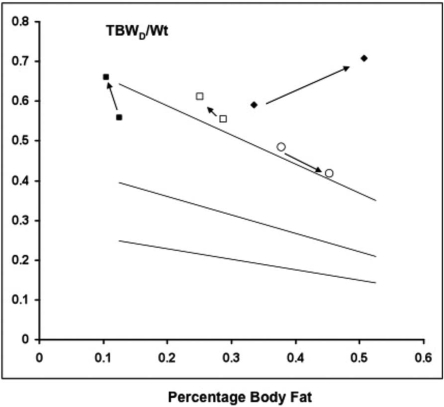
Figure 4.
Four examples of longitudinal body composition change in individual patients. The linear regression lines and layout are explained in the legend to Figure 3. Patient 1 (■), a 26-yr-old man with no comorbidity, lost 1.5 kg of actual weight during the study; despite this, he increased LBM and TBWD without becoming overhydrated. Patient 2 (○), a 43-yr-old woman without comorbidity, gained 16 kg during the year, increasing her body mass index from 31.4 to 37.5. BIA changes confirm the increase in obesity, TBWD confirms that her hydration status remained normal. Patient 3 (□) is a 50-yr-old man who had difficulty in achieving clinical dry weight as a result of intradialytic hypotension. He lost 3.5 kg during the year of study, but this is due in part to having undergone a nephrectomy. BIA suggests that weight loss is fat, but the disproportionate increase in TBWD indicates that he has become relatively overhydrated (not identified by BIA). Patient 4 (♦) is a 78-yr-old woman with severe comorbidity, including coronary heart disease, diabetes, and heart failure. She lost 9 kg in body weight. The BIA indicates an increase in percentage of body fat, but this is due to excessive loss in lean tissues. TBWD/wt is increased at baseline, indicating overhydration, but becomes much more so during the study, again not identified by the BIA.

