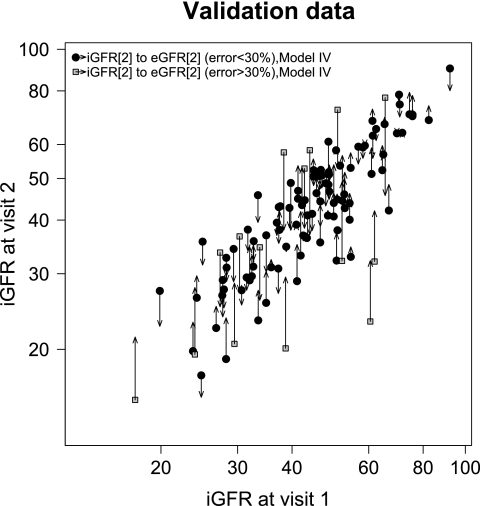
Figure 1.
Distribution of iGFR visit 2 measurements by iGFR at visit 1 within the training data (n = 220). The regression line fit for regressing iGFR at visit 2 on iGFR at visit 1 is shown (Table 3, model I). The magnitude of the error between iGFR and estimated GFR (eGFR) is illustrated by the length of the arrows with the origin at the observed data (iGFR1, iGFR2) and the arrowhead at the estimated value (iGFR1, eGFR2 using model IV, Table 3; data point at iGFR2 = 9.5 ml/min per 1.73 m2; not shown).

