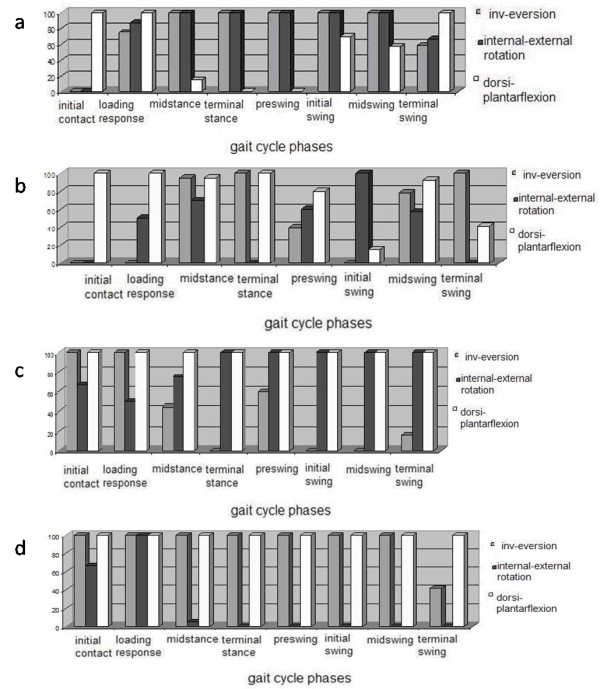
Figure 3.

Results of 1 way ANOVA analysis between neuropathic and control groups kinematics variables. Each phase of the gait cycle percentage of frames with p < 0.05 have been reported for each joint rotation. (a) Ankle joint rotation, foot subsegments rotation: (b) hindfoot vs tibia rotation, (c) midfoot vs hindfoot rotation, (d) forefoot vs midfoot rotation.
