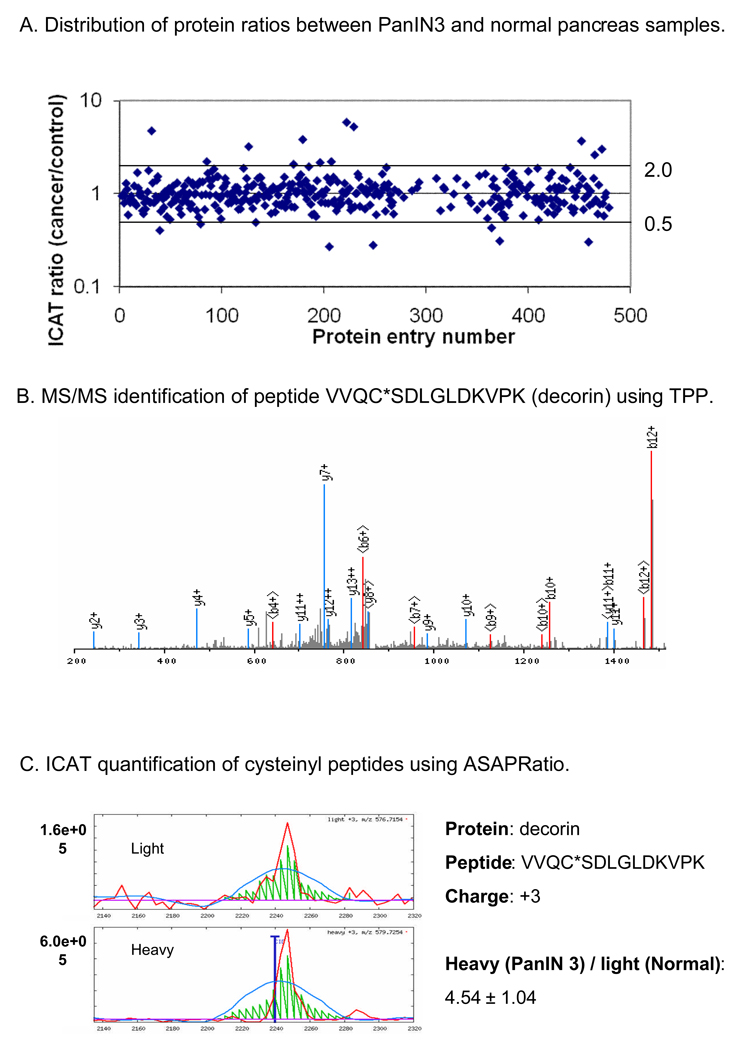
Figure 2. PanIN 3 protein expression profiling by ICAT.
A. Protein ratio distribution. B. An example of MS/MS spectrum for peptide identification. C. An example of peptide quantification by ICAT labeling. Note that 4.54 ± 1.04 is the ICAT ratio of a single peptide VVQC*SDLGLDKVPK, one of six peptides derived from protein decorin.

