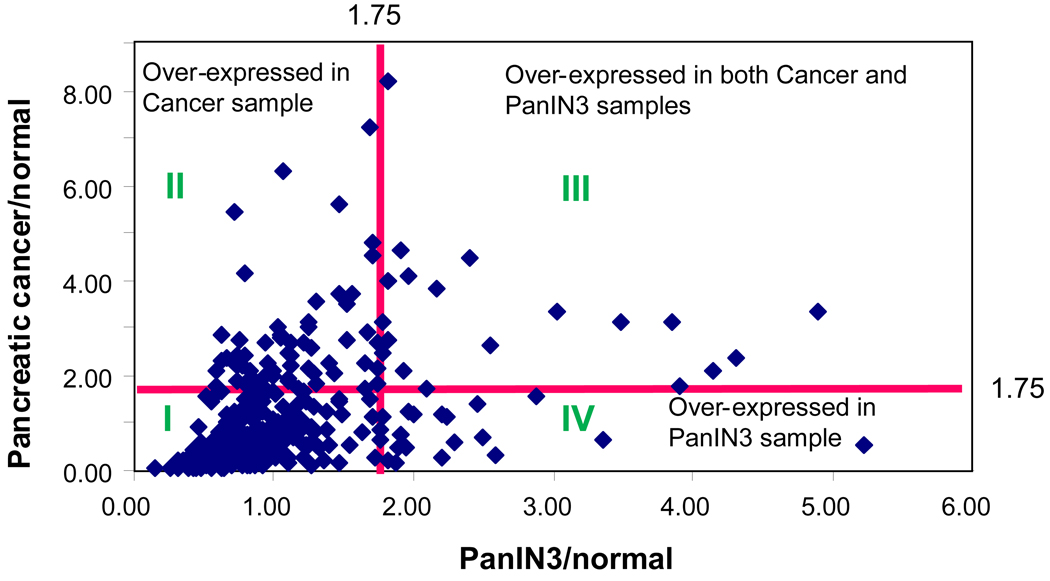
Figure 3. Distribution of the over-expressed proteins analyzed by iTRAQ analysis.
The distribution of the proteins can be divided into four regions based on their abundance ratio compared to the normal control; I. the proteins with expressional ratio <1.75 compared with normal control; II. the proteins overly expressed in pancreatic cancer sample only; III. the proteins overly expressed in both cancer and PanIN3 samples; IV. the proteins overly expressed in PanIN3 samples only.

