
Figure 5. Phonological Similarity Effects with Visual Presentation.
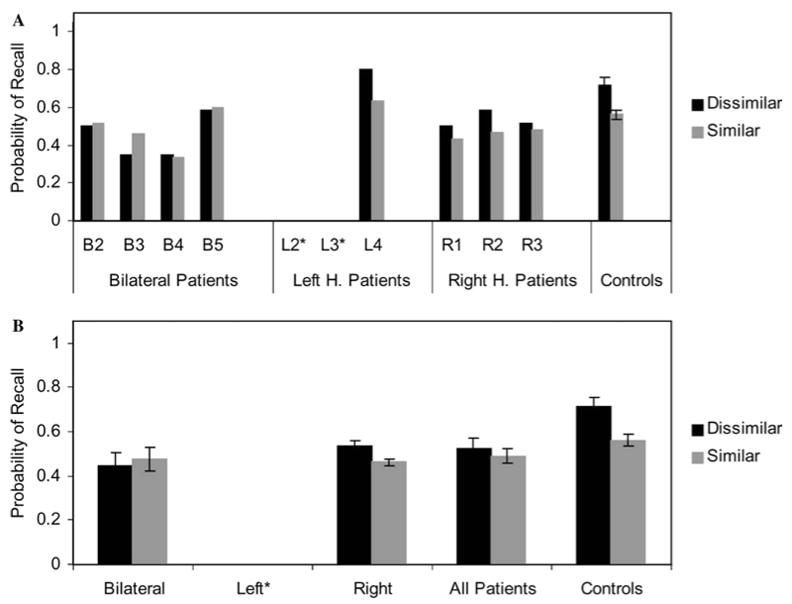
The probability of recalling a word is shown for both phonologically dissimilar contexts (black) and phonologically similar contexts (gray), for the individual patients (A) and the groups (B). These data are for the trials in which words were presented visually. (Only one left hemisphere patient participated in the visual portion of the study, thus no left-hemisphere group data are shown in the lower plot.)