Abstract
Over the past decade, fluorescent proteins (FPs) have become ubiquitous tools in biological research. Yet, little is known about the natural function or evolution of this superfamily of proteins that originate from marine organisms. Using molecular phylogenetic analyses of 102 naturally occurring cyan fluorescent proteins, green fluorescent proteins, red fluorescent proteins, as well as the nonfluorescent (purple-blue) protein sequences (including new FPs from Lizard Island, Australia) derived from organisms with known geographic origin, we show that FPs consist of two distinct and novel regions that have evolved under opposite and sharply divergent evolutionary pressures. A central region is highly conserved, and although it contains the residues that form the chromophore, its evolution does not track with fluorescent color and evolves independently from the rest of the protein. By contrast, the regions enclosing this central region are under strong positive selection pressure to vary its sequence and yet segregate well with fluorescence color emission. We did not find a significant correlation between geographic location of the organism from which the FP was isolated and molecular evolution of the protein. These results define for the first time two distinct regions based on evolution for this highly compact protein. The findings have implications for more sophisticated bioengineering of this molecule as well as studies directed toward understanding the natural function of FPs.
Keywords: fluorescent protein, molecular evolution, positive selection, conserved region
Introduction
Green fluorescent protein (GFP) was first discovered in the bioluminescent hydromedusa, Aequorea victoria (Shimomura et al. 1962), and later proteins homologous to GFP were found to be highly prevalent, and in several different colors, within tropical nonbioluminescent corals (Matz et al. 1999; Gruber et al. 2008). The ability of fluorescent proteins (FPs) to be functionally expressed in heterologous organisms (Chalfie et al. 1994) and the creation of useful bioengineered variants (Tsien 1998) have led to their widespread use as an in vivo imaging tool in many areas of biology (Misteli and Spector 1997; Ataka and Pieribone 2002; Lippincott-Schwartz and Patterson 2003; Livet et al. 2007). FPs are relatively small proteins (about 230 amino acid residues long) and possess the ability to produce several colors via two or three consecutive autocatalytic reactions that involve a three–amino acid chromophore. Despite extensive research using FPs and the molecule being the subject of extensive molecular engineering (Tsien 1998) and structure/function studies (Ormö et al. 1996), its evolutionary history is still unresolved, and previous phylogenetic analyses of different colored FPs have reported contradictory results: some analyses separate the proteins into clades based on color (Ugalde et al. 2004; Field et al. 2006; Kao et al. 2007; Alieva et al. 2008), whereas others do not (Kelmanson and Matz 2003; Shagin et al. 2004).
FPs are found in marine organisms predominantly within the phylum Cnidaria and are estimated to have evolved over 700 Ma, before Cnidaria and the Bilateria separated (Shagin et al. 2004). FPs exhibit a wide diversity of excitation/emission spectra that extend from cyan to far red but are generally grouped according to four basic colors: three fluorescent ones (cyan, green, and red) and a nonfluorescent protein (purple-blue) (Kelmanson and Matz 2003). Single organisms have been shown to express multiple FP genes and in a variety of fluorescent colors (Kelmanson and Matz 2003; Kao et al. 2007) with distinct anatomical expression patterns (Gruber et al. 2008). Within the scleractinian coral, Montastrea cavernosa, GFP is estimated to be ancestral to red fluorescent protein, evolving through small incremental transitions (Ugalde et al. 2004; Field et al. 2006). It has been recently suggested that parallel evolution of color diversity has occurred among FPs (Alieva et al. 2008).
In addition, FPs also exist in several marine Pontellidae species (Arthropoda: Crustacea: Maxillopoda: Copepoda: Pontellidae) (Shagin et al. 2004) that are evolutionarily distant from the two classes of Cnidaria (Hydrozoa and Anthozoa) where they were previously solely reported. The great diversity of FP in such widely divergent organisms, along with their structural similarity to many other proteins, has led to the suggestion that FPs comprise a “superfamily” of proteins (Shagin et al. 2004). Besides the possibility that the FP gene has been passed onto these organisms by horizontal gene transfer from jellyfish or corals to copepods, FPs likely evolved before the separation of Bilateria and Cnidaria, and thus, almost every animal taxon can potentially contain FP homologs. In support of this notion, it was discovered that nidogens are structural homologs of FPs that exist in mammals (Hopf et al. 2001). Although nidogens share little primary sequence homology and are nonfluorescent, the globular extracellular regions of the nidogens are structurally identical to FPs (Hopf et al. 2001). These extracellular regions of nidogens are involved in binding to another extracellular matrix protein, the perlecans and these shared structures suggest that an additional attribute of the beta can geometry is to provide a rigid binding surface.
Materials and Methods
cDNA Synthesis, Cloning, and Sequencing of FPs
Methods for RNA extraction, cDNA synthesis, and specific cloning of FPs from the Australian Great Barrier Reef and M. cavernosa have been described previously (Kao et al. 2007). In most cases, a set of degenerate primers were used to amplify a conserved region of the molecule. The following pool of degenerate primers (at 1 μM total concentration with each primer present in equimolar concentrations) was used for the 5′ end: ARAAGGCGCACCWCTSCCWTTYGC, AGCCYCTGCCTTTYGCGTTTGACATATTG, AGCCYCTGCCTTTYGCGTTTGACATATTG, CCCCTKCCATTCTCCTTTGAC, and GAAGGCGSDCCTCTGCCBTTCTCTTWTGATATC. The following pool of degenerate primers (at 1 μM total concentration with each primer present in equimolar concentrations) was used for the 3′ end: GTCTTCTTYTGCATMACWGGWCCATYRGCAGG, AGCGATCTTCTTCTGCATRACTGGWCC, ATCTTCTTCTGCATRACTGGWCCATTGGSRGG, and GTCTTTTTGCATCACRGGTCCGTYRSYRGGG. The degenerate primers were used to amplify cDNA derived from the coral specimens, and the resulting DNAs were cloned into pCR4Blunt-TOPO (Invitrogen, Carlsbad, CA) and sequenced. Sequences that were homologous to previously known FPs were used to design internal primers for amplifying the entire cDNA. The method of inverse polymerase chain reaction performed on a library of circularized cDNA was used to obtain the full-length clone (Kuniyoshi et al. 2006).
FPs were constitutively expressed in pCR4Blunt-TOPO (Invitrogen). Expression was visualized by plating bacteria onto CircleGrow agar plates (MP Biomedicals, Irvine, CA) supplemented with kanamycin (20 μg/ml) and charcoal (2% w/v) to suppress endogenous fluorescence from bacterial media. Colonies were visualized using Illumatool (Lightools Research, Encinitas, CA).
Sequences and Alignment
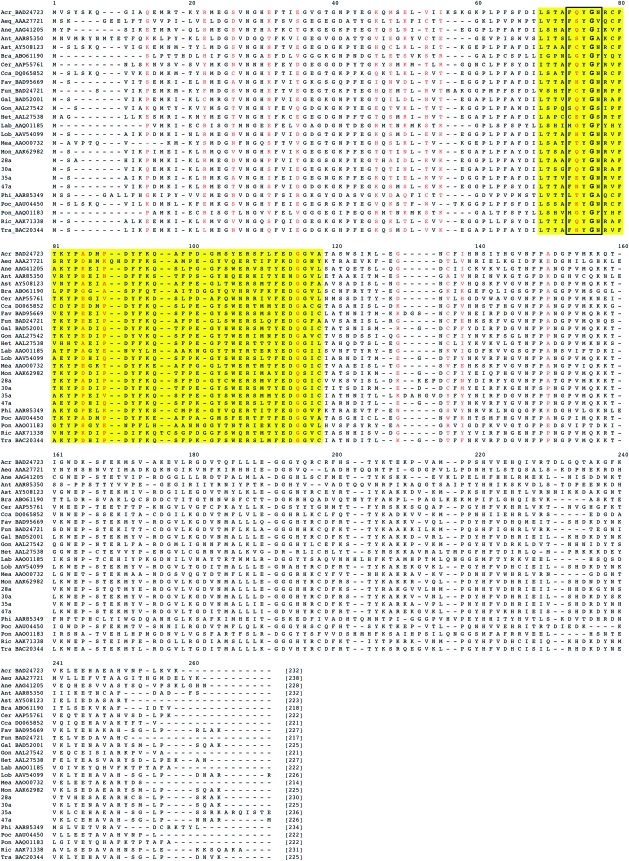
The FPs in this study were obtained from our sequencing efforts and from GenBank. All sequences generated for this study were deposited in GenBank under accession numbers (to be added). Amino acid and DNA sequences were collated and were aligned using MAFFT (Katoh et al. 2005) default settings. Although some gaps were observed in the alignment in the N-terminal region, most of the protein is trivial with respect to alignment (fig. 1 and supplementary file 2, Supplementary Material online).
FIG. 1.—
Alignment of a subset of FPs, spanning all representative genus. Phylogenic analysis was performed on the 104 sequences listed in the supplementary file 1 (Supplementary Material online).
Phylogenetic Tree Generation
All phylogenetic trees were generated using PAUP* (Swofford 2000) (fig. 2 and supplementary file 1, Supplementary Material online). Standard parsimony settings were used in all analyses, and robustness was assessed with bootstrap and jackknife analyses as well as Bayesian approaches using MrBayes (using the parsmodel option). In general, trees generated were well resolved and supported despite the small number of characters present (45 for the conserved chromophore regions and 225 for the flanking nonchromophore regions; supplementary files 3 and 4, Supplementary Material online) in each of the partitioned matrices.
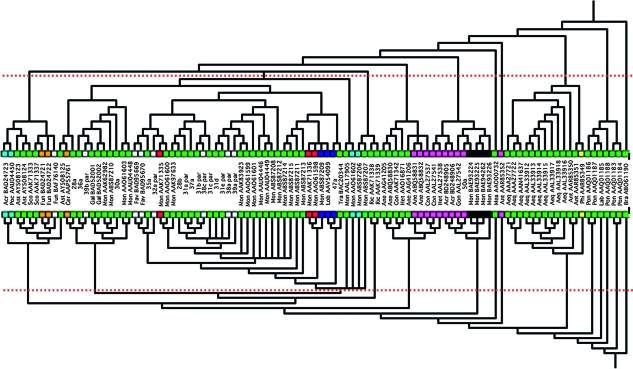
FIG. 2.—
Trees generated for the chromophore region (bottom) and for the nonchromophore terminal regions (top). The trees were generated using parsimony and robustness of nodes inferred with bootstrap analyses. The dotted lines indicate the general region of the trees where robustness falls below 70%. Bayes analyses were also performed (see supplementary file 3, Supplementary Material online), and the dotted line also indicates the general region where posterior probabilities fall below 0.90. Colors at the tips of the tree indicate the color of the GFP—green = green; light blue = cyan; orange = orange; black = mutant; yellow = yellow; pink = chromatic; red = red; dark blue = Kaede; and white = unknown.
Detection of Distinct Regions
The phylogenetic matrix was partitioned using the charset option in PAUP* (see supplementary file 2, Supplementary Material online). The interior potential chromophore region was partitioned into 40-residue sliding windows as indicated in the charpar partitions. The congruence of each of these internal sliding windows as well as the congruence of the N-terminal end with the C-terminal end was determined using the “hompart” option in PAUP* utilizing 100 random partitioning steps.
Correlation Studies of Taxonomy, Biogeography, and Fluorescence
Taxonomic, biogeographic, and fluorescence characteristics of each protein were coded. Three characters chosen to be as independent as possible were used to code each (see supplementary file 4, Supplementary Material online) as the Kishino–Hasegawa, Templeton, and winning sites test can only be accomplished in PAUP* with a minimum of three characters. To accomplish these tests, we first trimmed the matrix to remove redundant taxa using MacClade (Maddison WP and Maddison DR 1992). The resulting matrix was partitioned into a terminal regions partition and the chromophore region partition. Trees were generated for both partitions (899 resulted for the chromophore region and 6 for the terminal regions) using parsimony. These trees were tested against each other using the “pscores” option in PAUP* that performs the Kishino–Hasegawa test, the Templeton nonparametric test, and the winning sites test. In addition, consensus trees were generated for the chromophore region and the terminal regions. MacClade was used to determine the number of steps shorter each of these consensus trees was compared with the other for each residue position. This analysis shows that the sliding window covering the residues 70–115 fit the chromophore consensus tree better than the terminal consensus tree.
Detecting Natural Selection and Evolutionary Rates
The HYPHY package (Kosakovsky et al. 2005) was used to detect specific amino acid sites under positive Darwinian selection and to determine evolutionary rates. Aligned amino acid sequences were examined using the datamonkey Web site (http://www.datamonkey.org/). The Whelan and Goldman (WAG) model of rate change was used in all calculations of dN/dS. The SLAC method (Kosakovsky and Frost 2005), which is the most conservative approach for detecting selection, and the FEL/IFEL approach (Kosakovsky and Frost 2005) were used via the datamonkey Web site to infer selection. The results from both approaches were generally congruent and indicated that the same or similar set of sites were under selection. Rates of evolution of the 45-residue chromophore region versus the rest of the protein were estimated using HYPHY (Kosakovsky et al. 2005) with the relratio option. Default settings were used, and the relative ratio of the rates of these two regions of the protein was tested using six different criteria: Dayhoff, WAG, Jones, Fitness, EX, and reversible model (for details of each, see HYPHY; Kosakovsky et al. 2005).
Results
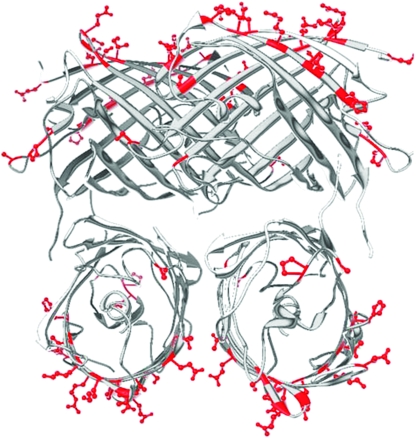
Molecular evolutionary analysis of 18 Indo-Pacific coral FPs (9 full length, 9 partial length) and 10 Caribbean FPs (all full length) cloned by this group (Kao et al. 2007) and 74 additional FP sequences (encompassing Scleractinia, Actiniaria, Corallimorpharia, Ceriantharia, Hydroida, Copepoda, and Amphioxus) of known geographic origin (supplementary file 1, Supplementary Material online) revealed a conserved region located approximately in the middle of the molecule that includes the light-emitting tripeptide chromophore (i.e., for enhanced green fluorescent protein, Ser65-Tyr66-Gly67) (figs. 1, 3, and 6). Molecular phylogenetic analyses were then undertaken by partitioned analysis of this conserved region and the remainder of the protein. The initial analyses using the intensive longitudinal data (ILD) test revealed distinct evolutionary processes at work on a central conserved region and two flanking regions (we reject the null hypothesis of congruence at P > 0.25 with this test). The analysis was repeated by sliding a 40–amino acid window (representing the potential boundary size of the region) in the carboxyl direction by 5–amino acid increments (fig. 3) to precisely locate the boundary of the interior conserved region. This revealed a distinct central region, demarcated by residues 70–115 (figs. 1 and 3; residues correspond to sequence alignment, fig. 1). The central region displays a sharply divergent evolutionary pattern from the rest of the protein (ILD test; P > 0.25). This central region evolves slowly under stabilizing selection. Consistent with this finding, the rate of molecular change in this middle conserved region is much slower than the terminal regions (relative ratio of rates of terminal regions to the middle conserved region ranges from 1.68 to 1.77 depending on input criteria; see supplementary data, Supplementary Material online). This central region consists of the chromophore containing alpha helix and a single beta strand. The beta strand faces inward in the tetrameric FP complex (fig. 4). The terminal regions are under intense Darwinian selection and evolve rapidly with mutations appearing at sites of putative protein–protein interactions (fig. 5), with no difference (ILD test; P < 0.01) observed between the amino and carboxyl regions. In addition, phylogenetic trees generated from the middle region and from the combined terminal regions revealed that fluorescence color is significantly associated with the terminal hypervariable regions and not with the middle conserved region (KH test P < 0.013–0.039; Templeton test P < 0.022–0.039; marginal significance winning site test P < 0.071–0.125). Surprisingly, similar tests for association of geography or taxonomy with these FP regions were not significant.
FIG. 3.—
Regions of divergent molecular evolution in FPs. Map of a typical FP is shown with terminal regions in blue, the internal chromophore region in yellow, and the 3-residue chromophore in red. Below the map are lines representing 40-residue sliding window segments (with region designated) that were examined for congruence with the terminal regions. Blue lines indicate sliding windows that were shown to be incongruent with the terminal regions with statistical significance. The histogram below the map plots the difference in number of steps it takes to construct a phylogenetic tree using the N/C-terminal regions versus the middle region, for each residue in the protein. Residue position is indicated at the bottom.
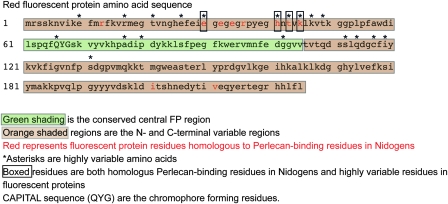
FIG. 6.—
FP residues homologous to perlecan-binding residues in nidogen proteins.
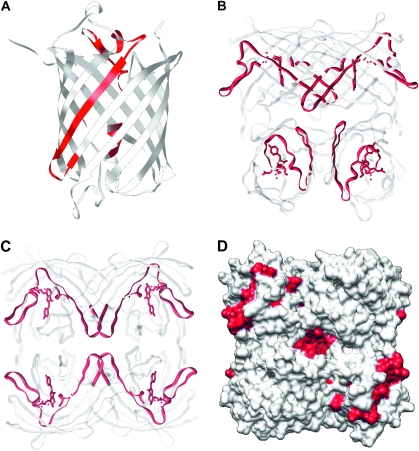
FIG. 4.—
The conserved central domain (red) and flanking variable domains (white/grey) imposed on a ribbon diagram of monomer (A) and tetramer (B and C) of the red fluorescent protein crystal structure. (B) A standard view of the tetramer. (C) A slight rotation to highlight the proximity of the beta strands of the conserved region. (D) Electron density map created in Chimera (Pettersen et al. 2004) depicting residues (in red) corresponding to the middle conserved region mapped to the crystal structure of discosoma red flourescent protein.
FIG. 5.—
Ball and stick diagram depicting residues (in red) undergoing rapid molecular change mapped to the crystal structure of discosoma red fluorescent protein. These residues were determined by analyses of FPs derived from Montastrea cavernosa from different geographic regions (supplementary data, Supplementary Material online).
FPs were aligned to the structure of nidogens, a family of extracellular matrix proteins that unexpectedly displayed a nearly identical crystal structure to that of FPs (Hopf et al. 2001). The N-terminal hypervariable amino acids of FPs form a surface patch that closely aligns with the conserved binding region of the nidogens (fig. 6).
Discussion
The results indicate that FPs possess two regions under distinct molecular evolutionary pressures. When aligned to the crystal structure, residues undergoing rapid evolution map to a single patch on the exterior of the tetramer and point outward (fig. 5). By contrast, the middle conserved region contains the chromophore followed by a single beta strand, part of which forms a pocket or channel (figs. 3 and 4) in the center of the tetrameric structure. However, this central conserved region does not appear to contain those residues necessary for tetramerization of FPs. Based on the sequence of the entire protein, FPs separate on the basis of color (Ugalde et al. 2004; Field et al. 2006; Kao et al. 2007); however, only the terminal hypervariable regions of FPs, which do not include the chromophore, track with color evolution. Conversely, the region containing the chromophore evolves independently from the rest of the protein and does not track fluorescence color (fig. 2). After identifying the conserved internal region, we hypothesized that this region might group according to taxonomy or geographic origin as it does not include hypervariable regions. However, no correlation was found using both the internal conserved region as well as the entire FP sequence. It is possible that such correlations do exist, but it may require a larger and more diverse sample size to reveal.
For a remarkably compact protein appreciated mainly for its chromatic properties, FPs contain distinct regions—one containing the chromophore (45 internal residues) and the other enclosing it (50 residues on the N-terminus and 140 residues on the C-terminus)—with sharply contrasting evolutionary behavior largely unrelated to its chromatic properties. The highly divergent and externally facing terminal regions are likely involved in protein–protein interactions with a highly variable protein of external origin. In addition, we report additional hypermutable sites (19 sites; figs. 5 and 6) in this region as reported by Field et al. (2006) (11 sites). Consistent with the proposed binding function, alignment of FPs with the globular extracellular region of nidogens reveals that the N-terminal hypervariable amino acids of the FP form a surface patch that closely aligns with the conserved binding region of the nidogens (fig. 3). This conserved nidogen region is the surface that interacts with perlecans, the major protein-binding partner of nidogens (Kvansakul et al. 2001). By analogy, we propose that a main function of the hypervariable terminal regions of FPs is to bind to other protein targets.
This study reports, for the first time, these distinct regions of FPs with divergent evolution. As FPs require oxygen for chromophore formation and fluorescence (Tsien 1998) and quench superoxide radicals without altering fluorescence (Bou-Abdallah et al. 2006), this “pocket” (fig. 4) formed by the conservation of region structure may be related to this process. Future studies aimed at examining these separate regions of FPs may offer insights into more sophisticated bioengineering involving the exchange or mutagenesis of regions and may shed light on the elusive natural function and evolution of the molecule.
Supplementary Material
Supplementary files 1–4 and figure 1 are available at Molecular Biology and Evolution online (http://www.mbe.oxfordjournals.org/).
Supplementary Material
Acknowledgments
This work was supported by grants from the National Institutes of Health (GM070348, H.T.K.), National Science Foundation (#0920572, D.F.G.), and Earthwatch Foundation (V.A.P. and D.F.G.). We thank Colomban de Vargas for helpful discussions and Cardon Wallace for her expertise and assistance in the identification of corals.
References
- Alieva NO, Konzen KA, Field SF, Meleshkevitch EA, Hunt ME, Beltran-Ramirez V, Miller DJ, Wiedenmann J, Salih A, Matz MV. Diversity and evolution of coral fluorescent proteins. PLoS ONE. 2008;3:e2680. doi: 10.1371/journal.pone.0002680. [DOI] [PMC free article] [PubMed] [Google Scholar]
- Ataka K, Pieribone VA. A genetically targetable fluorescent probe of channel gating with rapid kinetics. Biophys J. 2002;82:509–516. doi: 10.1016/S0006-3495(02)75415-5. [DOI] [PMC free article] [PubMed] [Google Scholar]
- Bou-Abdallah F, Chasteen ND, Lesser MP. Quenching of superoxide radicals by green fluorescent protein. Biochim Biophys Acta. 2006;1760:1690–1695. doi: 10.1016/j.bbagen.2006.08.014. [DOI] [PMC free article] [PubMed] [Google Scholar]
- Chalfie M, Tu Y, Euskirchen G, Ward WW, Prasher DC. Green fluorescent protein as a marker for gene expression. Science. 1994;263:802–805. doi: 10.1126/science.8303295. [DOI] [PubMed] [Google Scholar]
- Field SF, Bulina MY, Kelmanson IV, Bielawski JP, Matz MV. Adaptive evolution of multicolored fluorescent proteins in reef-building corals. J Mol Evol. 2006;62:U3, 32–U315. doi: 10.1007/s00239-005-0129-9. [DOI] [PubMed] [Google Scholar]
- Gruber DF, Kao HT, Janoschka S, Tsai J, Pieribone VA. Patterns of fluorescent protein expression in scleractinian corals. Biol Bull. 2008;215:143–154. doi: 10.2307/25470695. [DOI] [PubMed] [Google Scholar]
- Hopf M, Gohring W, Ries A, Timpl R, Hohenester E. Crystal structure and mutational analysis of a perlecan-binding fragment of nidogen-1. Nat Struct Biol. 2001;8:634–640. doi: 10.1038/89683. [DOI] [PubMed] [Google Scholar]
- Kao HT, Sturgis S, DeSalle R, Tsai J, Davis D, Gruber DF, Pieribone VA. Dynamic regulation of fluorescent proteins from a single species of coral. Mar Biotechnol (NY) 2007;9:733–746. doi: 10.1007/s10126-007-9025-1. [DOI] [PubMed] [Google Scholar]
- Katoh K, Kuma K, Toh H, Miyata T. MAFFT version 5: improvement in accuracy of multiple sequence alignment. Nucleic Acids Res. 2005;33:511–518. doi: 10.1093/nar/gki198. [DOI] [PMC free article] [PubMed] [Google Scholar]
- Kelmanson IV, Matz MV. Molecular basis and evolutionary origins of color diversity in great star coral Montastraea cavernosa (Scleractinia: Faviida) Mol Biol Evol. 2003;20:1125–1133. doi: 10.1093/molbev/msg130. [DOI] [PubMed] [Google Scholar]
- Kosakovsky PSL, Frost SD. Not so different after all: a comparison of methods for detecting amino acid sites under selection. Mol Biol Evol. 2005;22:1208–1222. doi: 10.1093/molbev/msi105. [DOI] [PubMed] [Google Scholar]
- Kosakovsky PSL, Frost SD, Muse SV. HyPhy: hypothesis testing using phylogenies. Bioinformatics. 2005;21:676–679. doi: 10.1093/bioinformatics/bti079. [DOI] [PubMed] [Google Scholar]
- Kuniyoshi H, Fukui Y, Sakai Y. Cloning of full-length cDNA of teleost corticotropin-releasing hormone precursor by improved inverse PCR. Biosci Biotechnol Biochem. 2006;70:1983–1986. doi: 10.1271/bbb.60067. [DOI] [PubMed] [Google Scholar]
- Kvansakul M, Hopf M, Ries A, Timpl R, Hohenester E. Structural basis for the high-affinity interaction of nidogen-1 with immunoglobulin-like domain 3 of perlecan. EMBO J. 2001;20:5342–5346. doi: 10.1093/emboj/20.19.5342. [DOI] [PMC free article] [PubMed] [Google Scholar]
- Lippincott-Schwartz J, Patterson GH. Development and use of fluorescent protein markers in living cells. Science. 2003;300:87–91. doi: 10.1126/science.1082520. [DOI] [PubMed] [Google Scholar]
- Livet J, Weissman TA, Kang H, Draft RW, Lu J, Bennis RA, Sanes JR, Lichtman JW. Transgenic strategies for combinatorial expression of fluorescent proteins in the nervous system. Nature. 2007;450:56–62. doi: 10.1038/nature06293. [DOI] [PubMed] [Google Scholar]
- Maddison WP, Maddison DR. MacClade: analysis of phylogeny and character evolution. Version 3.0. Sunderland (MA): Sinauer Associates; 1992. [Google Scholar]
- Matz MV, Fradkov AF, Labas YA, Savitsky AP, Zaraisky AG, Markelov ML, Lukyanov SA. Fluorescent proteins from nonbioluminescent Anthozoa species. Nat Biotechnol. 1999;17:969–973. doi: 10.1038/13657. [DOI] [PubMed] [Google Scholar]
- Misteli T, Spector DL. Applications of the green fluorescent protein in cell biology and biotechnology. Nat Biotechnol. 1997;15:961–964. doi: 10.1038/nbt1097-961. [DOI] [PubMed] [Google Scholar]
- Ormö M, Cubitt AB, Kallio K, Gross LA, Tsien RY, Remington SJ. Crystal structure of the Aequorea victoria green fluorescent protein. Science. 1996;273:1392–1395. doi: 10.1126/science.273.5280.1392. [DOI] [PubMed] [Google Scholar]
- Pettersen EF, Goddard TD, Huang CC, Couch GS, Greenblatt DM, Meng EC, Ferrin TE. UCSF chimera—a visualization system for exploratory research and analysis. J Comput Chem. 2004;25:1605–1612. doi: 10.1002/jcc.20084. [DOI] [PubMed] [Google Scholar]
- Shagin DA, Barsova EV, Yanushevich YG, et al. (13 co-authors) GFP-like proteins as ubiquitous metazoan superfamily: evolution of functional features and structural complexity. Mol Biol Evol. 2004;21:841–850. doi: 10.1093/molbev/msh079. [DOI] [PubMed] [Google Scholar]
- Shimomura O, Johnson FH, Saiga Y. Extraction, purification and properties of aequorin, a bioluminescent protein from the luminous hydromedusan Aequorea. J Cell Comp Physiol. 1962;59:223–239. doi: 10.1002/jcp.1030590302. [DOI] [PubMed] [Google Scholar]
- Swofford DL. PAUP*: phylogenetic analysis using parsimony (*and other methods). Version 4. Sunderland (MA): Sinauer Associates; 2000. [Google Scholar]
- Tsien RY. The green fluorescent protein. Annu Rev Biochem. 1998;67:509–544. doi: 10.1146/annurev.biochem.67.1.509. [DOI] [PubMed] [Google Scholar]
- Ugalde JA, Chang BS, Matz MV. Evolution of coral pigments recreated. Science. 2004;305:1433. doi: 10.1126/science.1099597. [DOI] [PubMed] [Google Scholar]
Associated Data
This section collects any data citations, data availability statements, or supplementary materials included in this article.


