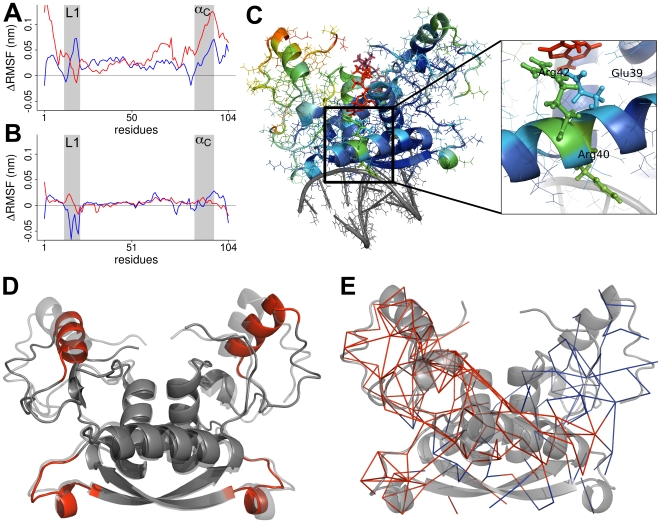
Figure 5. The dynamics of MetJ.
(A, B) MetJ-dna (A) and MetJ (B) show quenching of fluctuations upon SAM binding. Plotted are differences in backbone root mean square fluctuations  between apo and holo structures for both monomers (red and blue curves). Positive values indicate stiffening upon SAM binding. Loop 1 and helix C are underlaid in gray. Differences in
  can be explained by the fact that in the crystal structure, DNA is only in direct contact with loop 1 residues of one monomer. (C) Regions with decreased root mean square fluctuations (RMSF) color coded on the MetJ-dna structure. Colors range from blue for no change to red for strongly decreased fluctuations. Strong stiffening is observed for helix C (C′) and loop 1. Side-chain fluctuations of Glu39 and Arg42 are quenched due to direct interaction with SAM (zoom), whereas the stiffening of Arg40 is an indirect effect, compare to Fig. 3D. Stiffening spreads to large parts of helix A. (D) The most dominant mode of fluctuation derived from MD simulations of MetJ-dna mapped on a cartoon representation. The first three eigenvectors were used to generate the trajectory. The two overlaid structures show the extreme positions when projecting along these eigenvectors. Amplitudes of fluctuations were exaggerated for better visibility. Loop 1 and helix C are marked red. (E) The network propagating fluctuations between helix C and loop 1. PCA on residue averaged pair-wise forces
  for apo MetJ-dna reveals a network of coupled interactions (see Methods). Edges represent residue pairs for which the first eigenvector is
  . Edges within the first monomer are colored blue, those within the second red.

