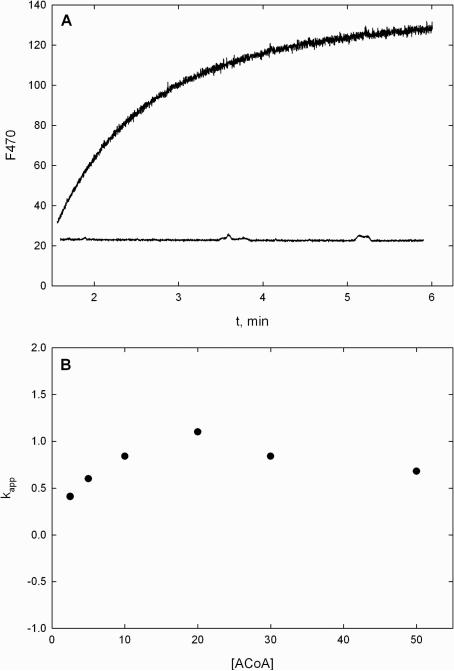
Figure 3.
Evaluation of the interaction between PqsD and ACoA by fluorescence spectroscopy. (A) Changes in fluorescence emission at 470 nm upon mixing 1 μM PqsD or the Cys112Ala mutant with 20 μM ACoA. (B) Plot of kobs vs ACoA using native PqsD revealing that the rate is insensitive to ACoA concentration and is faster than kcat.

