
Figure 3.
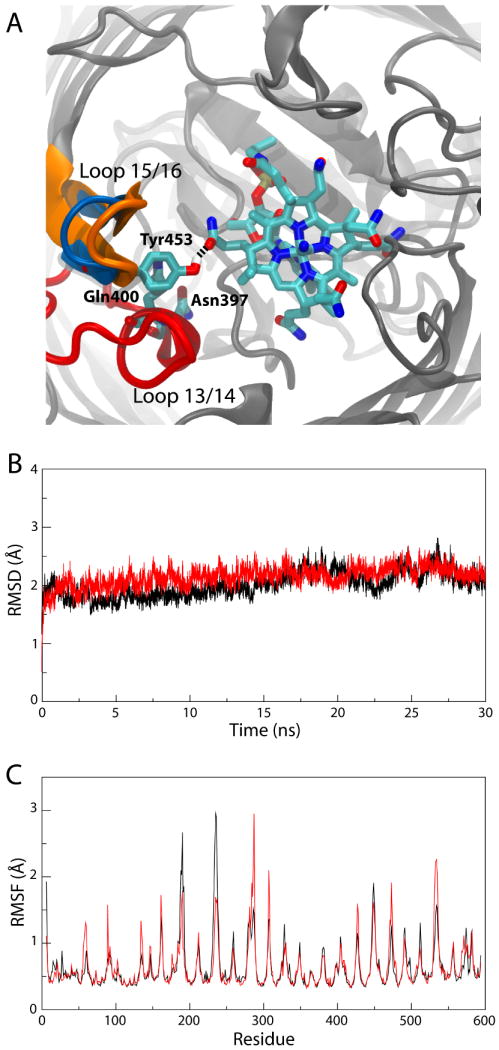
Simulation of the Ca2+/CN-Cbl-bound structure of BtuB. (A) Unique interactions observed during the simulation. The two loops involved, loops 13/14 and 15/16, are colored as in Fig. 1; the specific residues along with CN-Cbl are seen in a stick representation, colored by atom name. A snapshot of the simulation is shown in which Tyr453 hydrogen bonds to CN-Cbl. The crystallographic position of loop 15/16, farther away from CN-Cbl, is also indicated in blue. (B) RMSD of the extracellular loops vs. time and (C) RMSF vs. residue number for the Ca2+/CN-Cbl-bound structure of BtuB (red) and the Ca2+-bound structure (black).