
Figure 4.
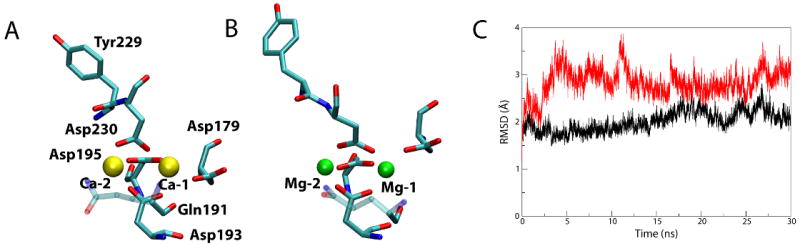
Comparison of Ca2+-bound and Mg2+-bound BtuB. (A) Ca2+ coordination after 30 ns. Residues interacting with the Ca2+ ions (yellow) are shown as sticks, colored by atom name. Gln191 is partially transparent so as not to obscure Asp193 behind it. (B) Mg2+ coordination after 30 ns. (C) RMSD of the extracellular loops vs. time for the simulation of the Mg2+-bound structure (red) compared to the simulation of the Ca2+-bound BtuB (black).