
Figure 5.
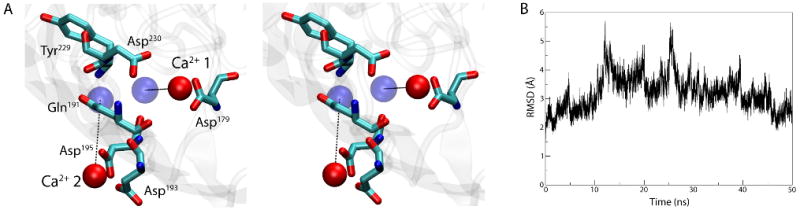
Binding of Ca2+ to the apo structure of BtuB. (A) Stereo view of the Ca2+ binding site after 50 ns of simulation. The Ca2+-binding residues are shown in a stick representation and the Ca2+ ions are drawn as red spheres. The positions of the ions in the crystal structure of the Ca2+-bound BtuB are indicated as blue spheres. (B) RMSD vs. time for loops 3/4, 5/6, and 7/8, compared to their positions in the crystal structure of the Ca2+-bound BtuB.