
Figure 1.
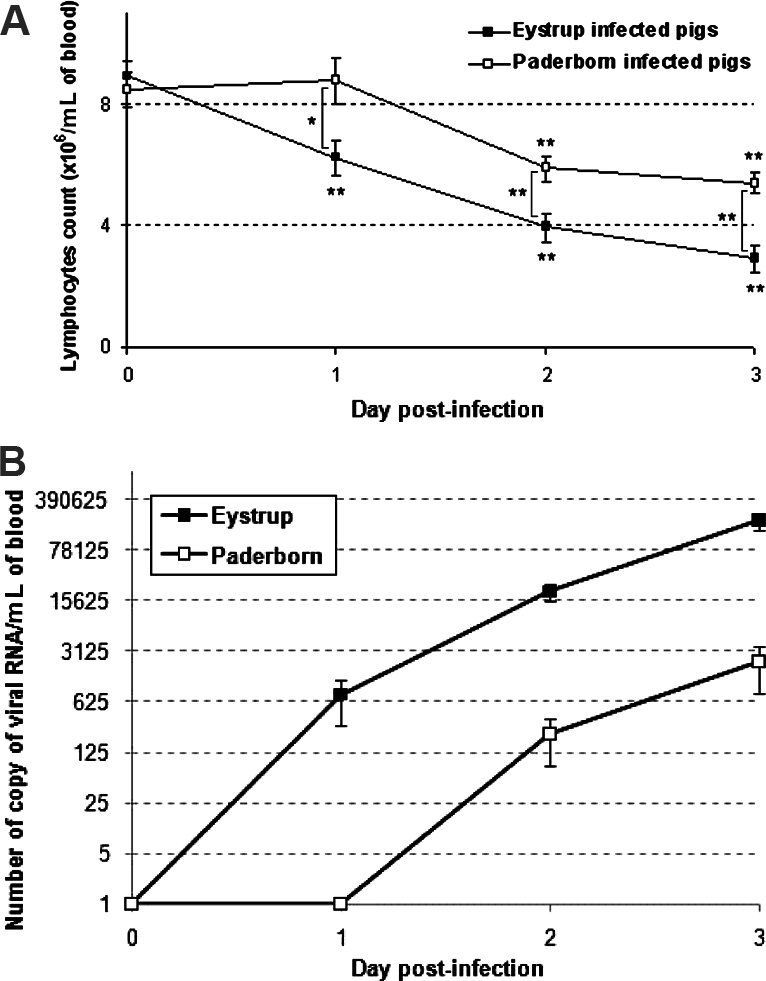
Blood lymphocyte counts (A) and virus genome quantification (B) for the time-course after CSFV infection. Results correspond to mean (± SE) results obtained for 8 pigs infected by Eystrup or 8 pigs infected by Paderborn. * p < 0.05 and ** p < 0.01 either compared each post-infection value with the respective D0 value using Paired Two-sample Student’s t-test, or the Eystrup values with Paderborn values using Two-sample Student’s t-test at each infection time-point.