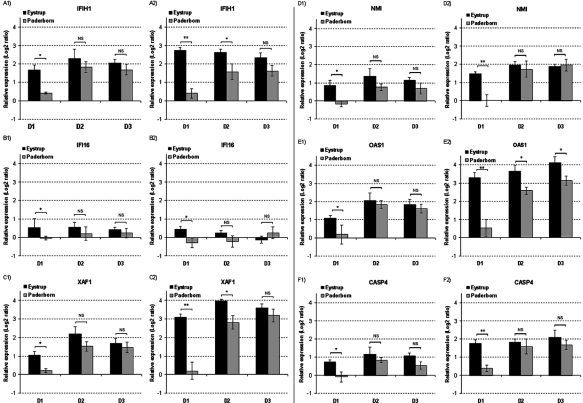
Figure 5.
Real-time PCR validation of the microarray data, performed for 6 selected genes differently modulated by the Eystrup strain in relation to the Paderborn strain. The microarray results for Interferon induced with helicase C domain protein 1 (IFIH1) (A), Interferon gamma inducible protein 16 (IFI16) (B), X-linked inhibitor of apoptosis (XIAP) associated factor 1 (XAF1) (C), N-Myc interactor (NMI) (D), 2′,5′ oligoadenylate synthetase 1 (OAS1) (E) and Caspase-4 (CASP4) (F) are presented on A1-F1 whereas the RT-PCR results are presented on A2-F2. The microarray values are the mean (± SE) of relative gene expression (Log2 ratios) obtained for each post-infection value in relation to the non-infected reference. The presented PCR values are relative expressions calculated from the CT results on D1, D2 and D3 pi and related to D0, as described in Materials and methods. They correspond to the mean (± SE) of the results obtained for the 8 pigs infected by Eystrup or the 8 pigs infected by Paderborn. * p < 0.05 and ** p < 0.01 compared Eystrup values with Paderborn values using Two-sample Student’s t-test at each infection time-point.

